Fig. 4.
Download original image
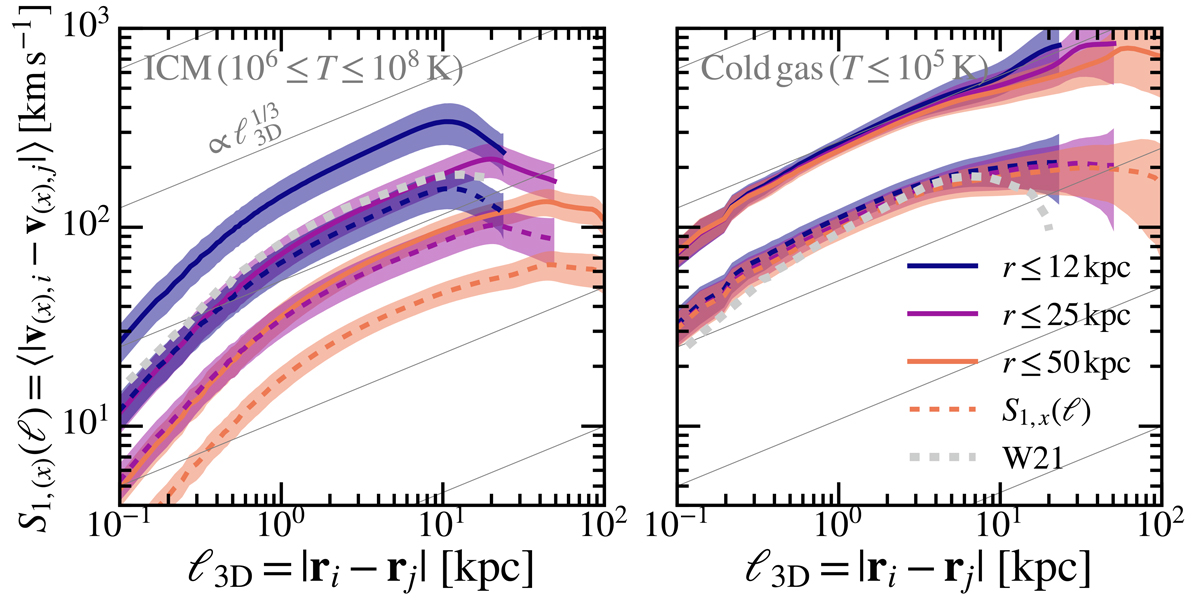
Velocity structure functions of the hot ICM (left panel) and the cold phase (right panel) for all gas located less than 12, 25, and 50 kpc away from the center of the simulated box. The dashed colored lines indicate the line-of-sight VSFs taking the x-component of the velocity field. We emphasize that the latter are not equivalent to projected VSFs, as the distance between pairs of cells is still three-dimensional (projected VSFs are discussed in Sect. 4). Colored area is showing standard deviation over time. The solid gray lines in the background indicate the Kolmogorov scaling law (Kolmogorov 1941). As our setup closely resembles the fiducial MHD run from Wang et al. (2021), we present the time-averaged line-of-sight VSFs for the hot and cold phases from that work, for radii r ≲ 10 kpc (dashed gray line labeled W21). A comparison of our results with this study is discussed in Sect. 5.2. We emphasize that VSFs below separations of ℓ ∼ 800 pc are likely to be steepened by the effect of numerical viscosity.
Current usage metrics show cumulative count of Article Views (full-text article views including HTML views, PDF and ePub downloads, according to the available data) and Abstracts Views on Vision4Press platform.
Data correspond to usage on the plateform after 2015. The current usage metrics is available 48-96 hours after online publication and is updated daily on week days.
Initial download of the metrics may take a while.