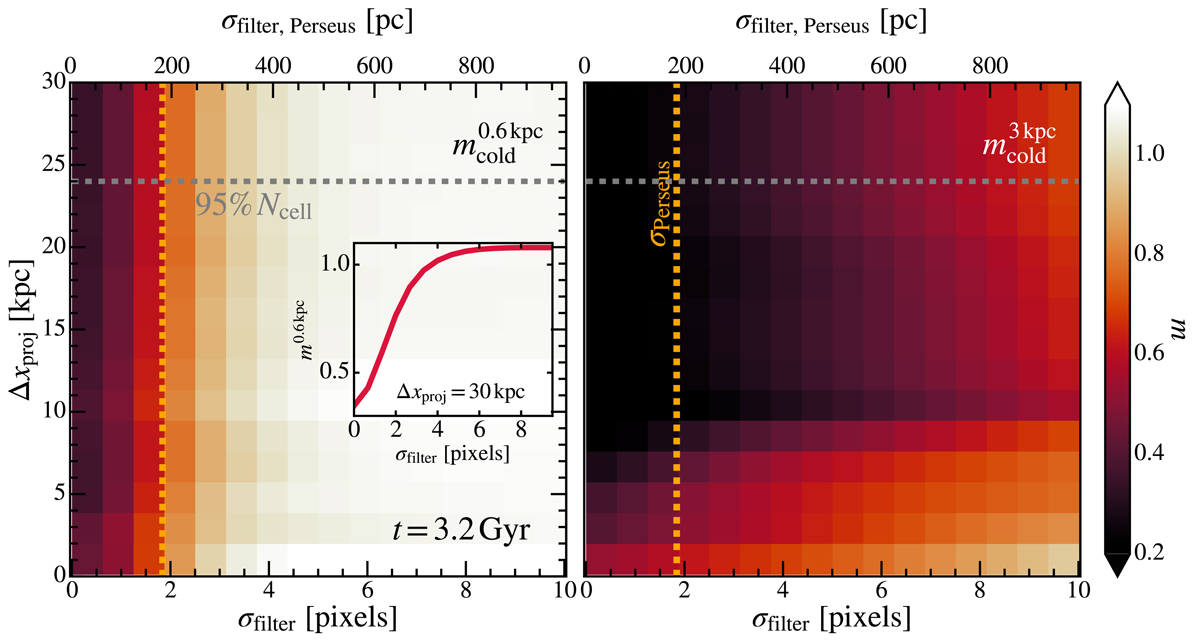
Fig. D.1.
Download original image
Various power-law indices measured by fitting the VSFs over ℓ = 0.6 ± 0.1 kpc (left panel) and ℓ = 3 ± 1 kpc (right panel) as a function of the Gaussian smoothing kernel size (expressed in pixels in the lower axis and in physical length for the upper axis, assuming the distance to the Perseus cluster for the later) on the horizontal axis and the depth of projection Δxproj along the vertical axis. The vertical orange dashed line indicates the standard deviation σPerseus of the smoothing effect for the Perseus cluster. The inner figure within the left panel is a 1D visualization of the uppermost row.
Current usage metrics show cumulative count of Article Views (full-text article views including HTML views, PDF and ePub downloads, according to the available data) and Abstracts Views on Vision4Press platform.
Data correspond to usage on the plateform after 2015. The current usage metrics is available 48-96 hours after online publication and is updated daily on week days.
Initial download of the metrics may take a while.