Fig. C.1.
Download original image
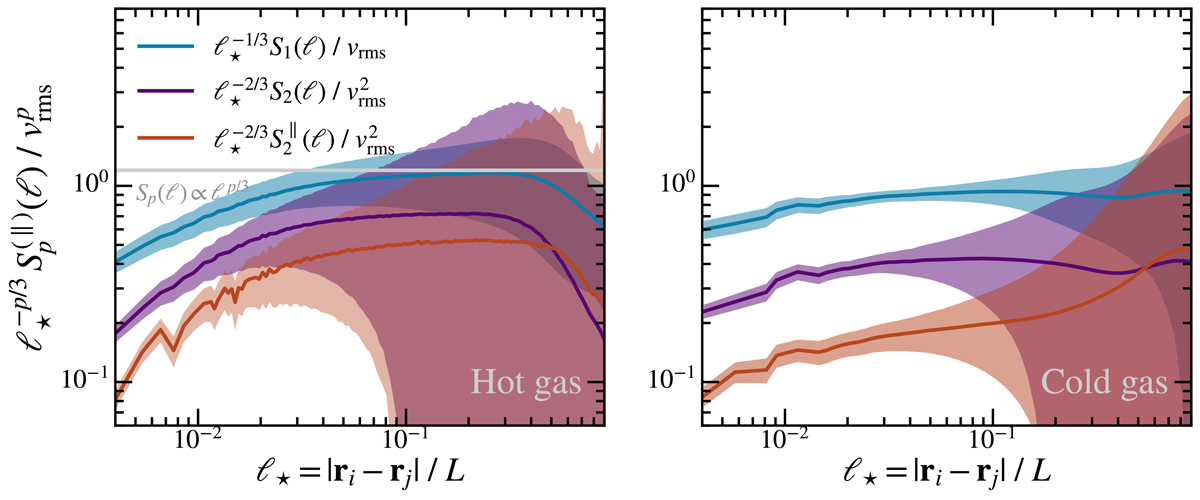
Comparison of the time-averaged first-order VSF (blue curve), second-order VSF (purple curve), and second-order longitudinal VSF (red curve) for the hot phase (left panel) and the cold phase (right panel). The separations scales have been normalized by the domain size L, and the VSFs have been normalized by their time-averaged root mean square velocity vrms. The colored areas represent the standard deviation resulting from time variation across all snapshots.
Current usage metrics show cumulative count of Article Views (full-text article views including HTML views, PDF and ePub downloads, according to the available data) and Abstracts Views on Vision4Press platform.
Data correspond to usage on the plateform after 2015. The current usage metrics is available 48-96 hours after online publication and is updated daily on week days.
Initial download of the metrics may take a while.