Open Access
Fig. 14.
Download original image
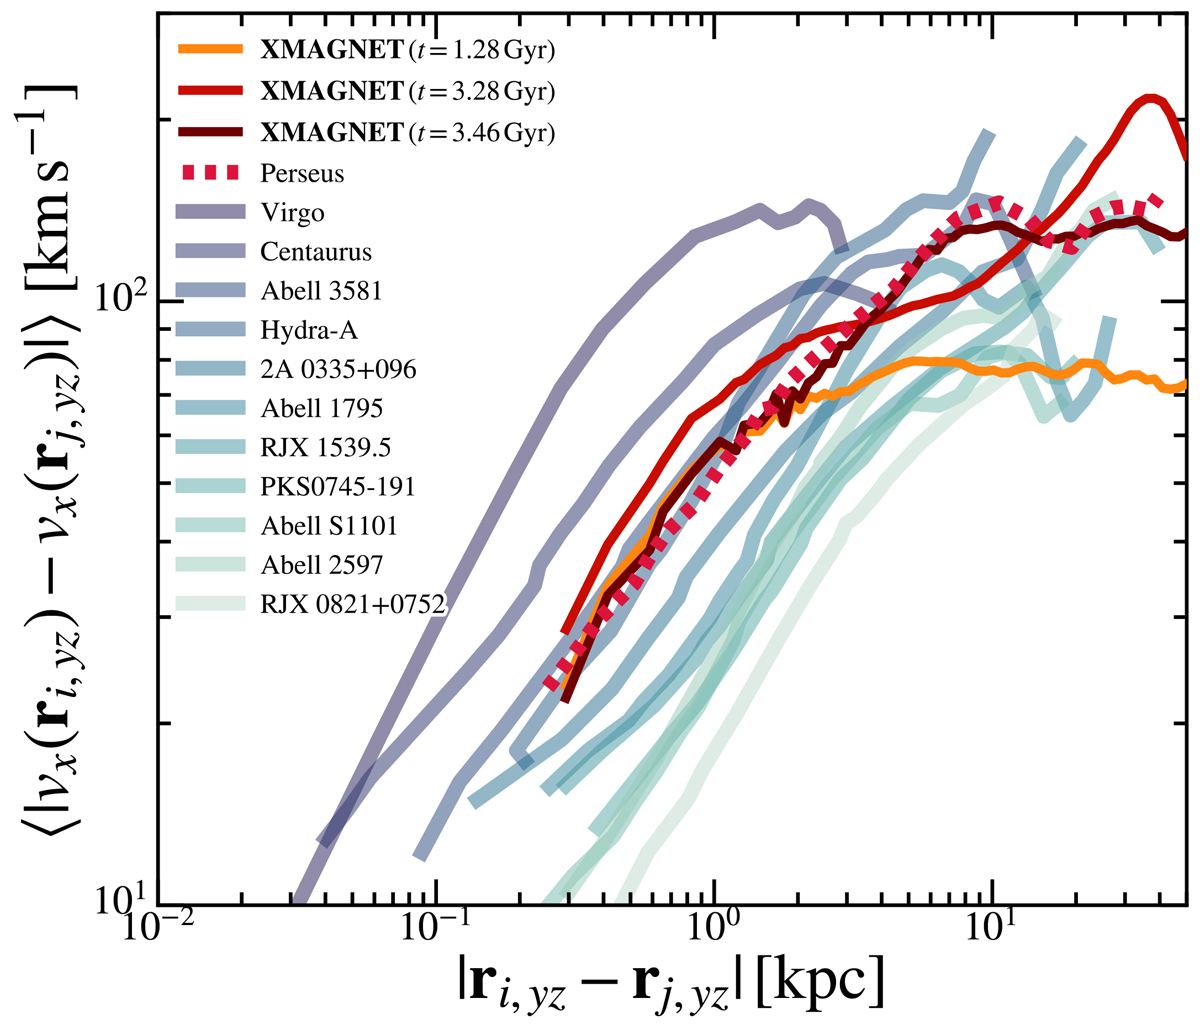
Projected cold gas VSFs including smoothing from atmospheric seeing at three different times in the simulation: 1.28 Gyr, 3.28 Gyr, and 3.48 Gyr (orange, red, and purple lines). For comparison, we also include the 11 VSFs of nearby BCGs from Ganguly et al. (2023) (thick blue lines and red dashed line).
Current usage metrics show cumulative count of Article Views (full-text article views including HTML views, PDF and ePub downloads, according to the available data) and Abstracts Views on Vision4Press platform.
Data correspond to usage on the plateform after 2015. The current usage metrics is available 48-96 hours after online publication and is updated daily on week days.
Initial download of the metrics may take a while.