Fig. 13.
Download original image
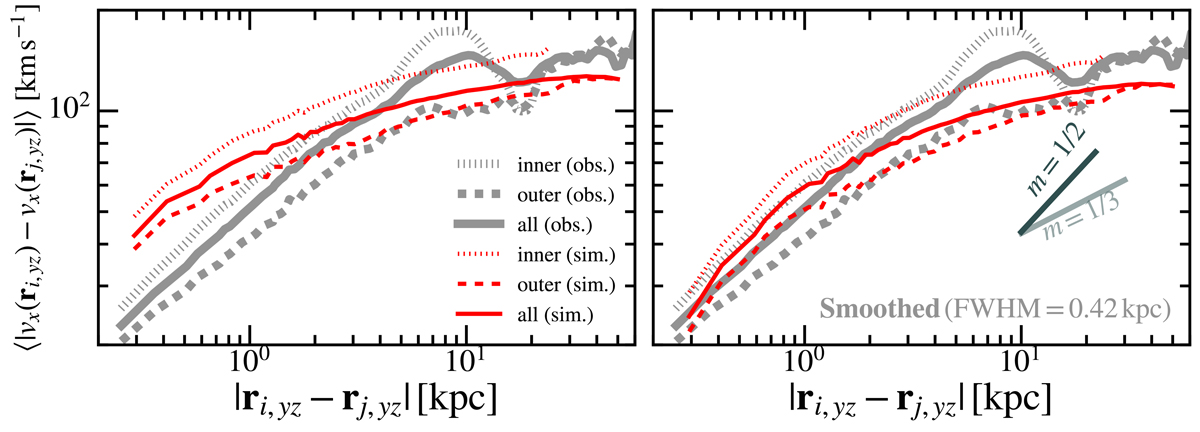
Time-averaged VSFs of the cold phase obtained from mock Hα emission-weighted maps projected along the x-axis (red lines) compared to observational data (gray lines, from Li et al. 2020). The images have been coarse-grained to a spatial resolution of 290 pc to mimic the spatial resolution of instruments assuming Perseus cluster distance. The right panel was obtained from smoothed maps to mimic the effects of atmospheric seeing. The labels “inner”, “outer”, and “all” (see legend) respectively designate the VSFs obtained from all gas cells located at a projected radii of less than 12 kpc, at a projected radius of more than 12 kpc, and for all gas cells irrespective of their radius.
Current usage metrics show cumulative count of Article Views (full-text article views including HTML views, PDF and ePub downloads, according to the available data) and Abstracts Views on Vision4Press platform.
Data correspond to usage on the plateform after 2015. The current usage metrics is available 48-96 hours after online publication and is updated daily on week days.
Initial download of the metrics may take a while.