Fig. 12.
Download original image
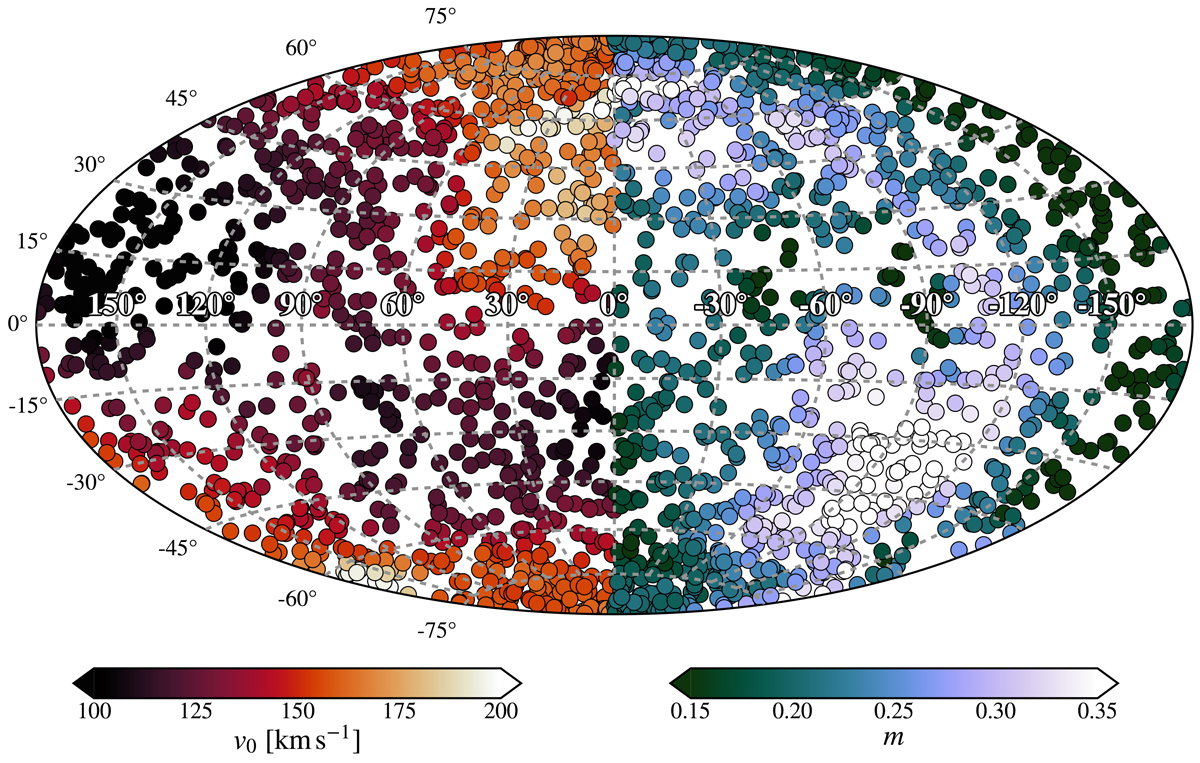
Aitoff projection of the values of the VSF amplitude v0 and the power-law index m, measured for 2000 randomly selected orientations at fixed time t = 3.2 Gyr within r = 25 kpc. Each VSF was computed from projected Hα emission weighted maps. The power-law fitting was performed between 2 and 4 kpc. As we do not include effects of opacity when generating the projection of the velocity maps used to obtain each VSF, the left and right half of the plot are symmetrical for both v0 and m. The coordinates of the jet injection axis is at θ = ±90°.
Current usage metrics show cumulative count of Article Views (full-text article views including HTML views, PDF and ePub downloads, according to the available data) and Abstracts Views on Vision4Press platform.
Data correspond to usage on the plateform after 2015. The current usage metrics is available 48-96 hours after online publication and is updated daily on week days.
Initial download of the metrics may take a while.