Fig. 1.
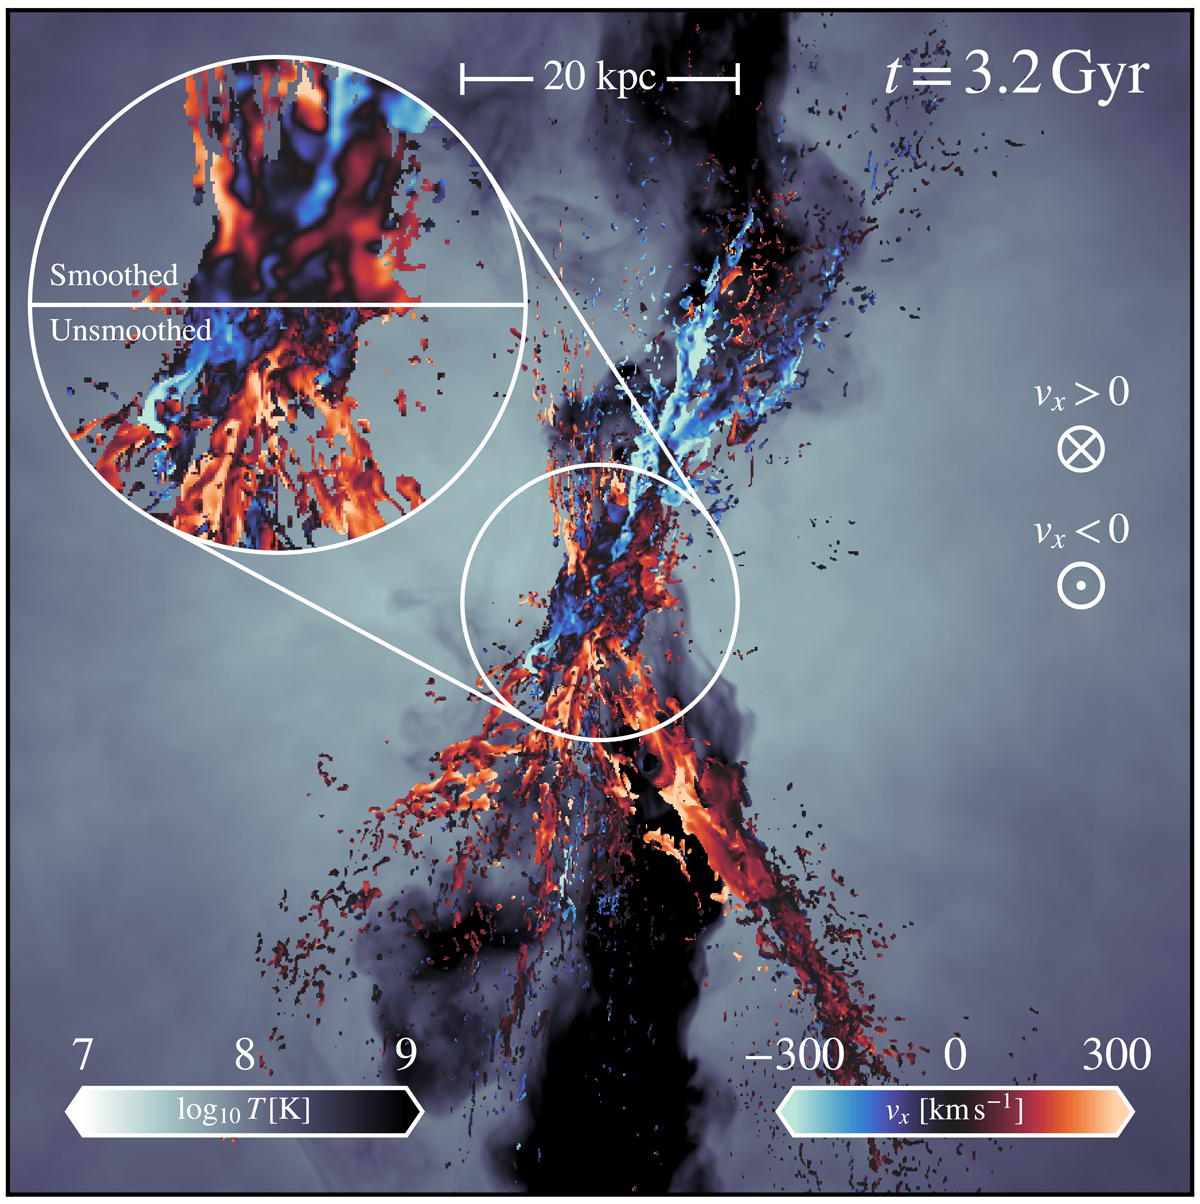
Download original image
Hα emission – weighted projection of the line-of-sight velocity for the inner 80 kpc of our simulated box at t = 3.2 Gyr. A zoom-in on the innermost region showcases the effect of atmospheric seeing on the map. The background image is a projection of the temperature field. The figure can be compared to Fig. 2 from Li et al. (2020). ⊙ and ⊗ markers indicate the directions pointing toward (away) from the viewer, associated with negative (positive) line-of-sight velocity (respectively). More detail on the emissivity weighting are provided in Sect. 4.1. A movie showing the three dimensional structure of the cold phase is available online.
Current usage metrics show cumulative count of Article Views (full-text article views including HTML views, PDF and ePub downloads, according to the available data) and Abstracts Views on Vision4Press platform.
Data correspond to usage on the plateform after 2015. The current usage metrics is available 48-96 hours after online publication and is updated daily on week days.
Initial download of the metrics may take a while.