Fig. 9
Download original image
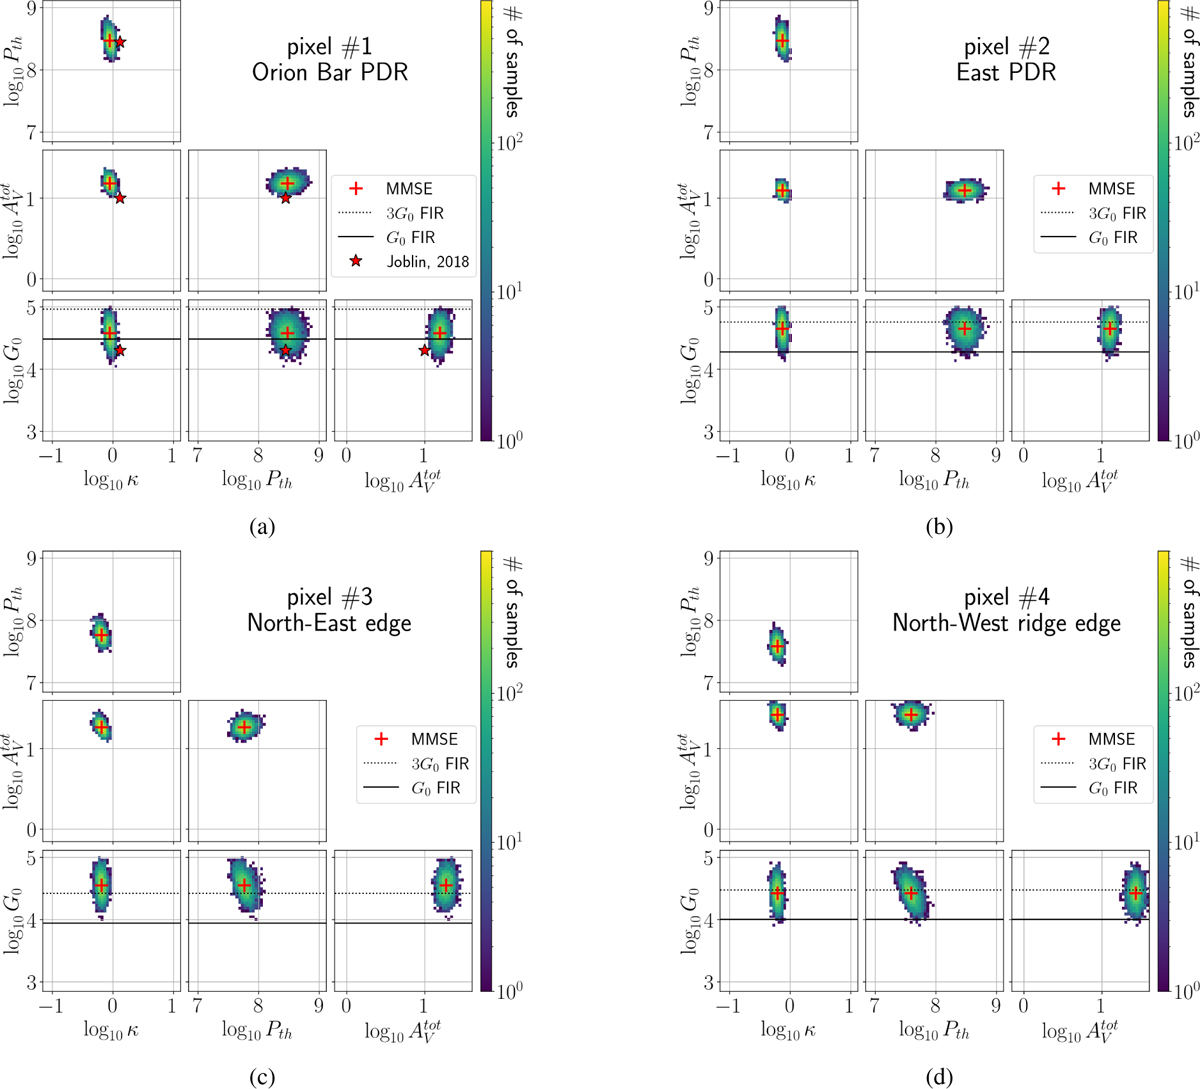
Inference results for OMC-1 on four specific pixels, presented as 2D marginal histograms of the θn samples. (a) Orion Bar PDR pixel (with the estimation from Joblin et al. 2018), (b) eastern PDR pixel, (c) North-east edge pixel, (d) North-west ridge edge pixel. The horizontal black line indicates the G0 values estimated from FIR luminosities from Goicoechea et al. (2015).
Current usage metrics show cumulative count of Article Views (full-text article views including HTML views, PDF and ePub downloads, according to the available data) and Abstracts Views on Vision4Press platform.
Data correspond to usage on the plateform after 2015. The current usage metrics is available 48-96 hours after online publication and is updated daily on week days.
Initial download of the metrics may take a while.