Fig. 6
Download original image
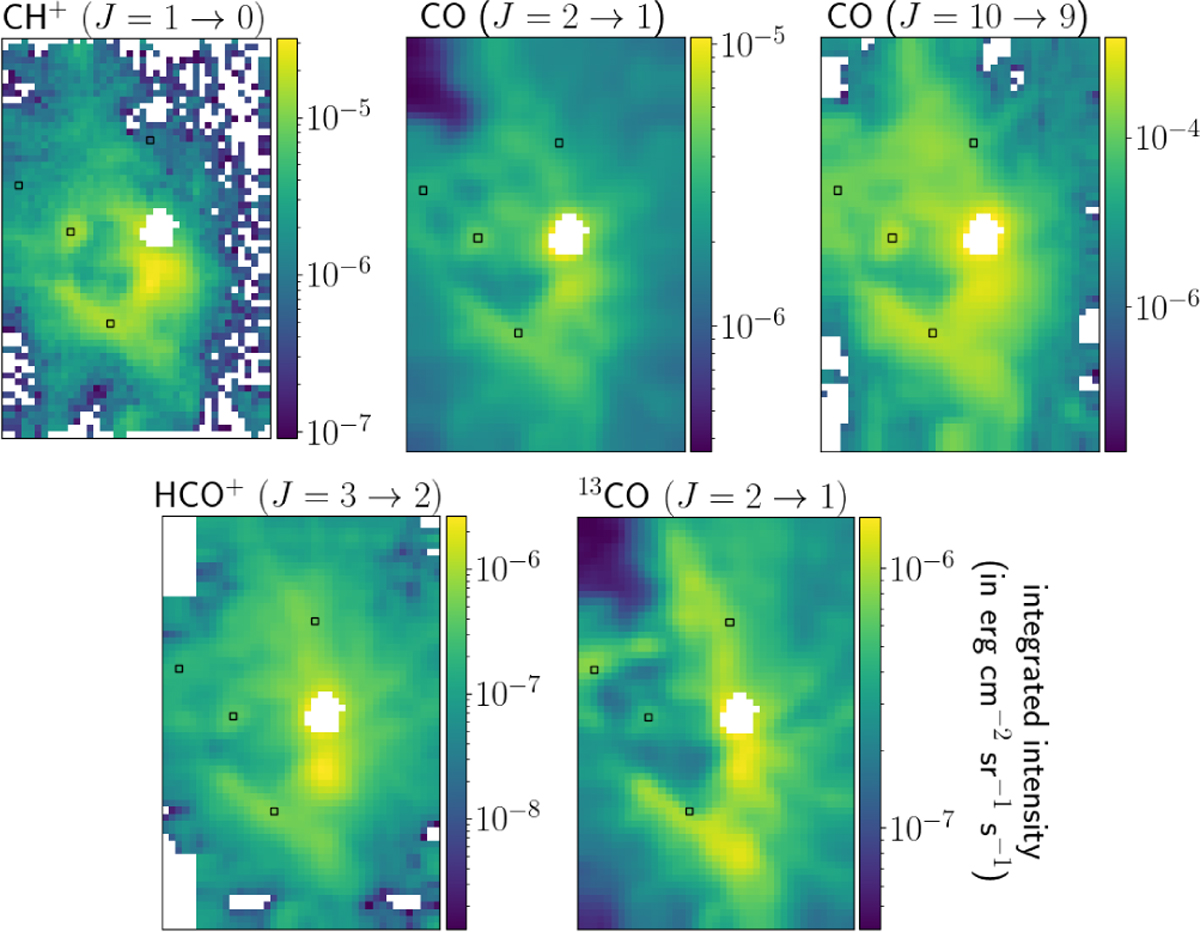
OMC-1 core observed integrated intensity maps of the lines used for inversion. The white region in the middle of the maps is the BN/KL region, dominated by shocks, and not considered in the inversion. The remaining white pixels correspond to negative integrated intensities due to the additive Gaussian noise. The inference results for the four pixels highlighted with a black square are detailed in Sect. 6.3.3.
Current usage metrics show cumulative count of Article Views (full-text article views including HTML views, PDF and ePub downloads, according to the available data) and Abstracts Views on Vision4Press platform.
Data correspond to usage on the plateform after 2015. The current usage metrics is available 48-96 hours after online publication and is updated daily on week days.
Initial download of the metrics may take a while.