Fig. 4
Download original image
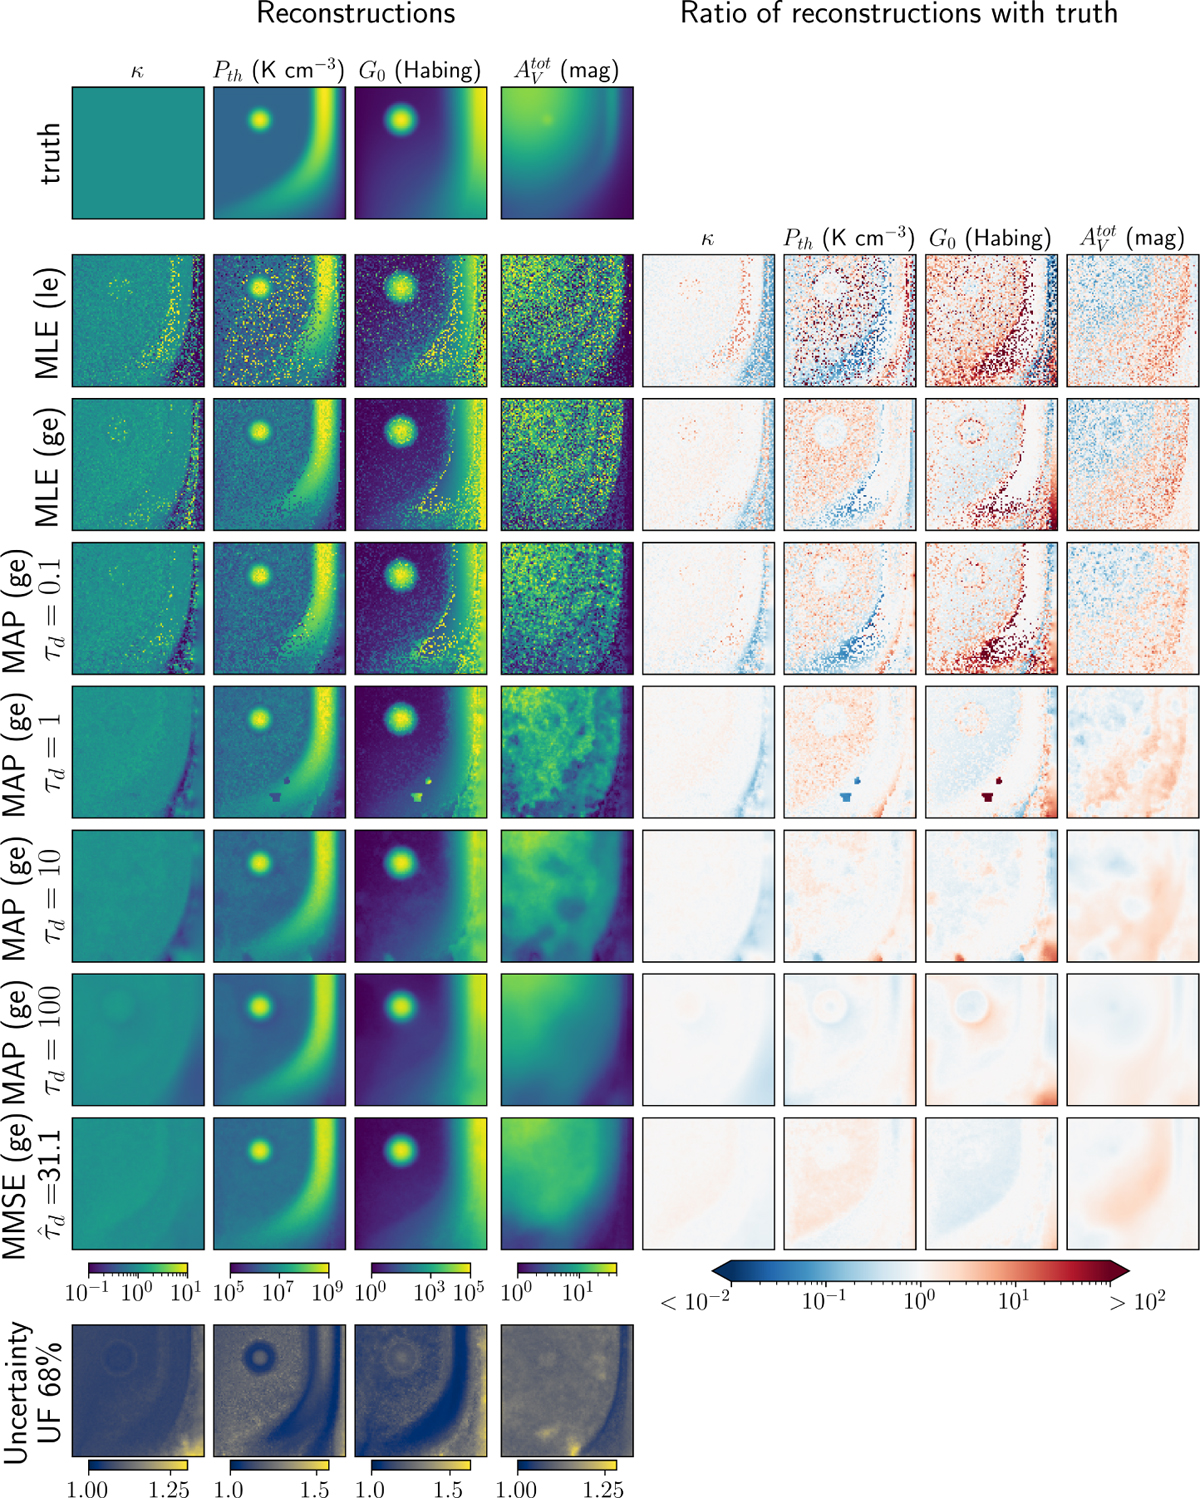
Reconstruction results for the Nside = 90 spatial resolution. The first row shows the D = 4 true maps that each estimator tries to reconstruct. The obtained reconstructions are shown below the true maps. The first estimator is “MLE (le)”: the MLE evaluated using the PMALA kernel only, that is, only local exploration. The second estimator is “MLE (ge)”: the MLE evaluated using both the PMALA and MTM kernels, that is, a combination of local and global exploration. The third to fifth estimators are MAP estimators (i.e., including spatial regularization) with different values for the regularization weight, τd. The sixth estimator is the MMSE, obtained with sampling. The associated regularization weight, τd, is inferred along with the physical parameters, Θ. The last row, “UF 68%”, quantifies the uncertainties associated with the MMSE by indicating the size of the 68% CI. The maps on the right display the ratios between the estimated and true maps, to better assess the quality of each estimation.
Current usage metrics show cumulative count of Article Views (full-text article views including HTML views, PDF and ePub downloads, according to the available data) and Abstracts Views on Vision4Press platform.
Data correspond to usage on the plateform after 2015. The current usage metrics is available 48-96 hours after online publication and is updated daily on week days.
Initial download of the metrics may take a while.