Fig. 2
Download original image
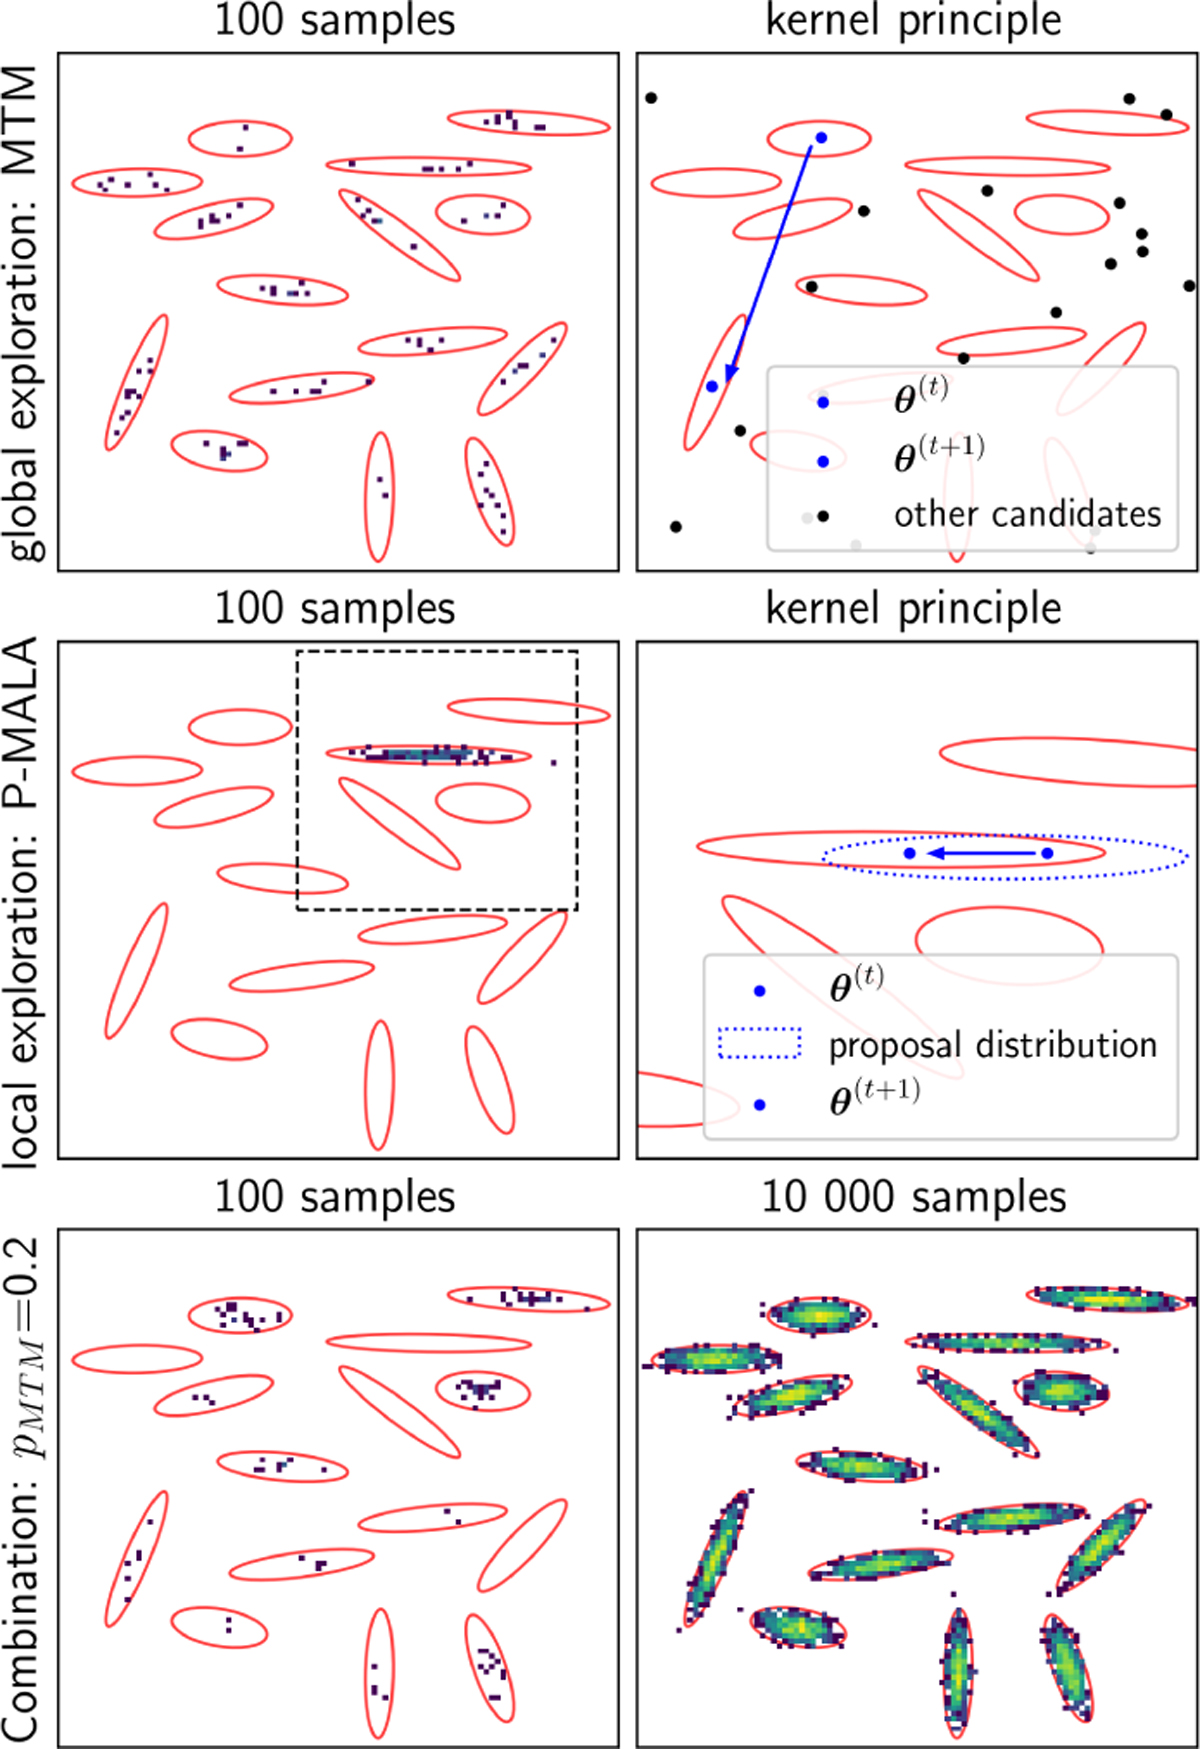
Illustration of the two transition kernels PMALA and MTM on a two-dimensional probability distribution: a Gaussian mixture model (shown with the red ellipses) restricted to validity intervals (shown with the large black square). Top: MTM update rule (on the right), and a histogram after 100 sampling steps (on the left). With this update rule only, the sampling visits all the distribution modes at the cost of computationally heavier individual steps. Middle: PMALA update rule (on the right), and a histogram after 100 sampling steps (on the left). With this cheaper update rule only, the sampling fails to visit all the distribution modes. Bottom: Two histograms obtained using both kernels after 100 steps (left) and 10 000 steps (right). The histograms converge to the correct distribution.
Current usage metrics show cumulative count of Article Views (full-text article views including HTML views, PDF and ePub downloads, according to the available data) and Abstracts Views on Vision4Press platform.
Data correspond to usage on the plateform after 2015. The current usage metrics is available 48-96 hours after online publication and is updated daily on week days.
Initial download of the metrics may take a while.