Fig. D.2
Download original image
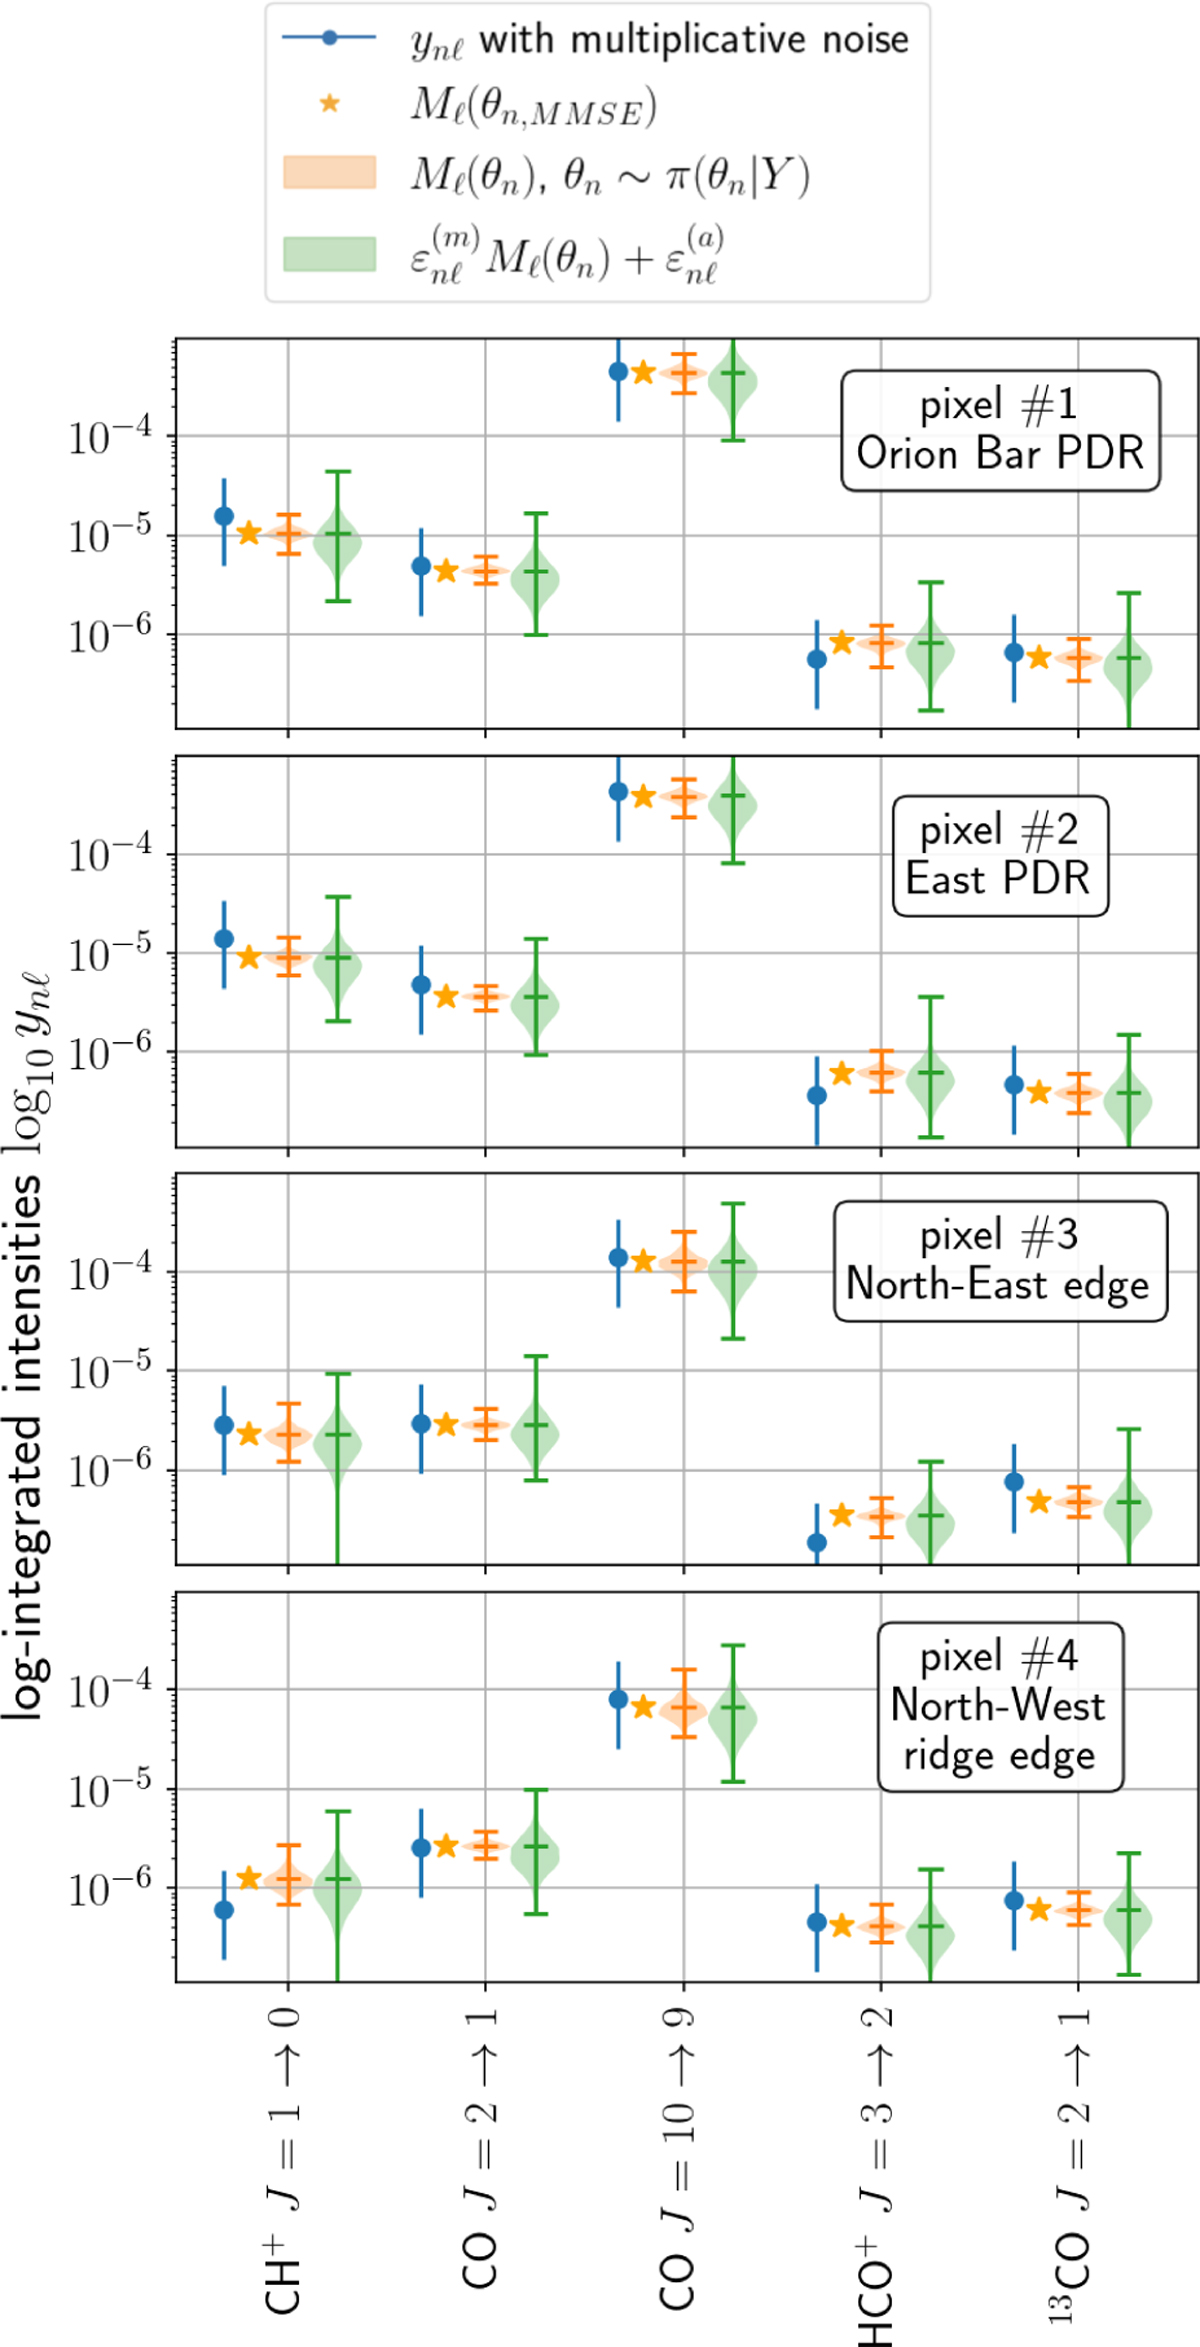
Visual diagnostic of the quality of the fit on the lines used for the inversion of OMC-1 for four pixels. The blue points are the actual observation with a 1σ error for the multiplicative noise. The orange stars are the prediction of the Meudon PDR code based on the MMSE. The orange violin plots show the predictions of the Meudon PDR code on samples of the posterior distribution. The green violin plots show the posterior predictive distribution by including addition and multiplicative noises.
Current usage metrics show cumulative count of Article Views (full-text article views including HTML views, PDF and ePub downloads, according to the available data) and Abstracts Views on Vision4Press platform.
Data correspond to usage on the plateform after 2015. The current usage metrics is available 48-96 hours after online publication and is updated daily on week days.
Initial download of the metrics may take a while.