Fig. 10
Download original image
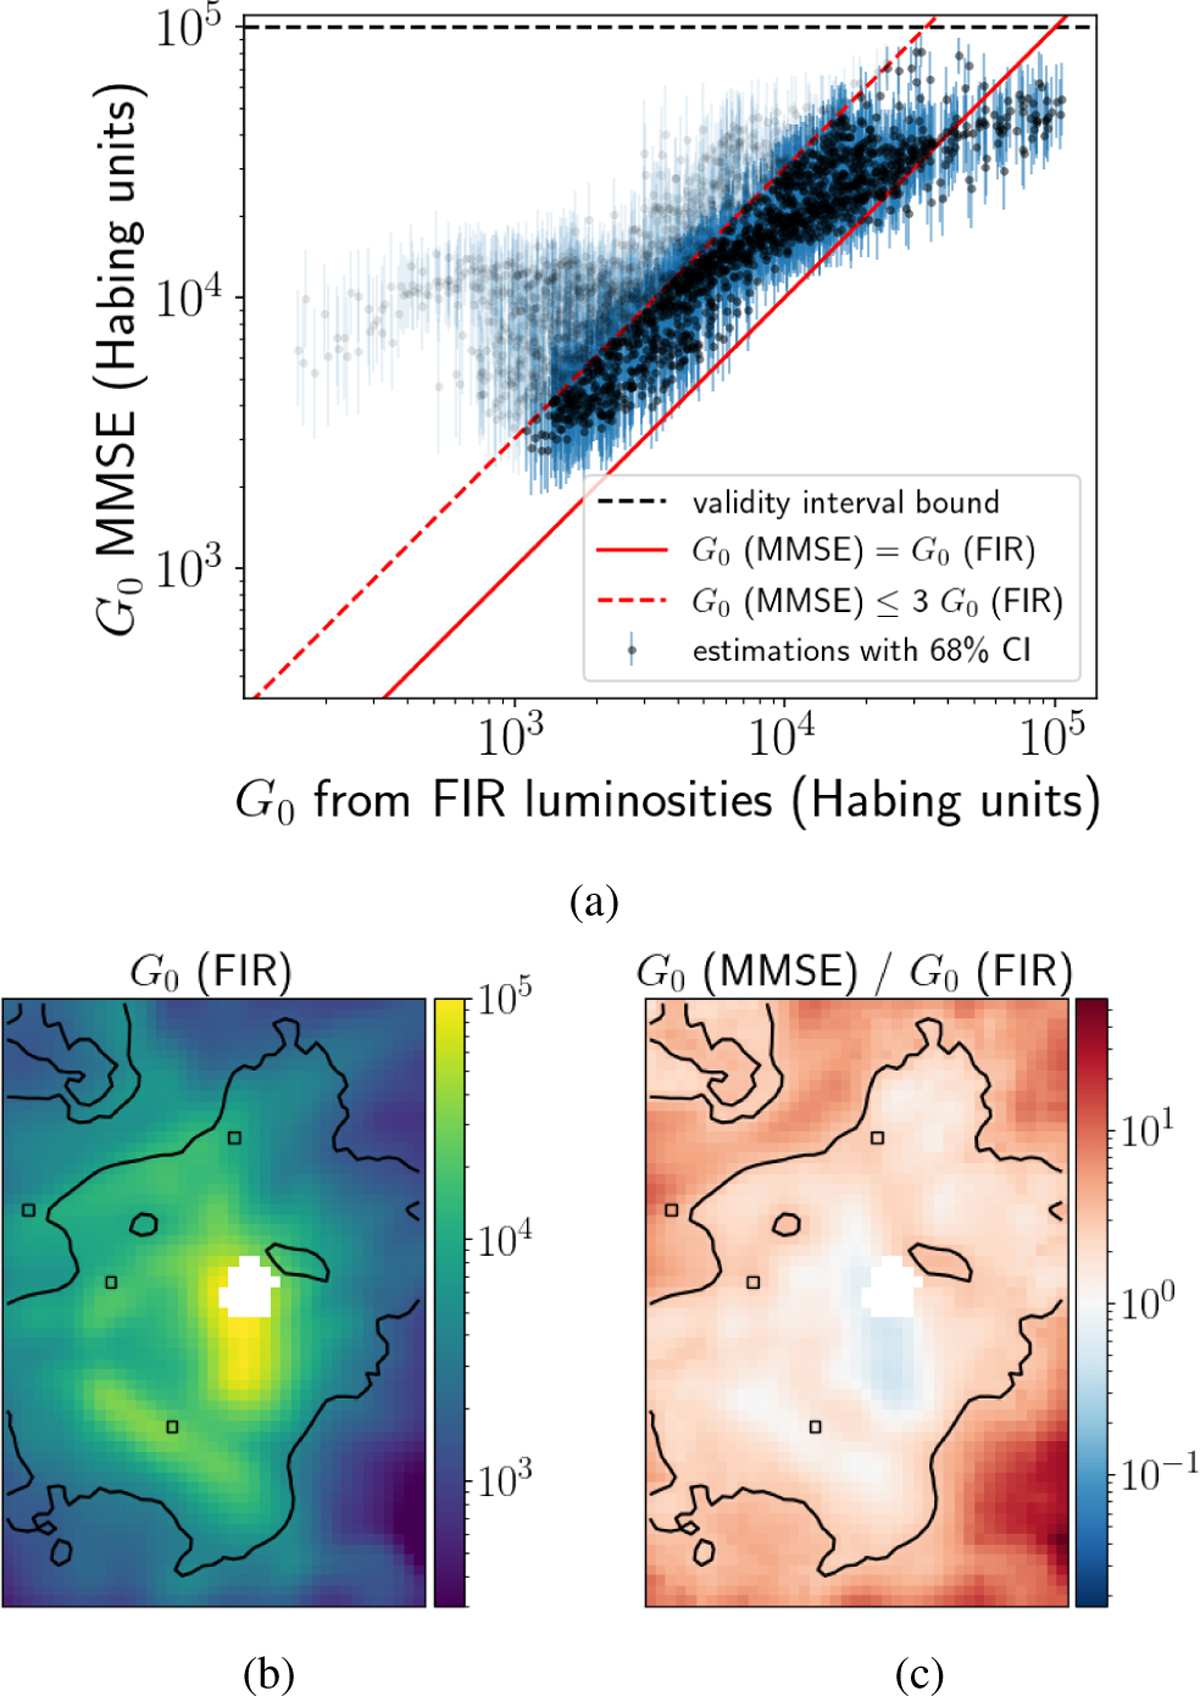
Comparison of our estimations of G0 with those of (Goicoechea et al. 2015) obtained from FIR luminosities. (a) Scatter plot of estimated G0, from our reconstruction and from FIR luminosities. (b) Map of estimated G0 with FIR luminosities, adapted from Goicoechea et al. (2019). (c) Map of the ratio between our G0 reconstructions and those based on FIR luminosities. In both maps, the black contour identifies the regions where G0 (MMSE) ≤ 3 G0 (FIR).
Current usage metrics show cumulative count of Article Views (full-text article views including HTML views, PDF and ePub downloads, according to the available data) and Abstracts Views on Vision4Press platform.
Data correspond to usage on the plateform after 2015. The current usage metrics is available 48-96 hours after online publication and is updated daily on week days.
Initial download of the metrics may take a while.