Fig. 4
Download original image
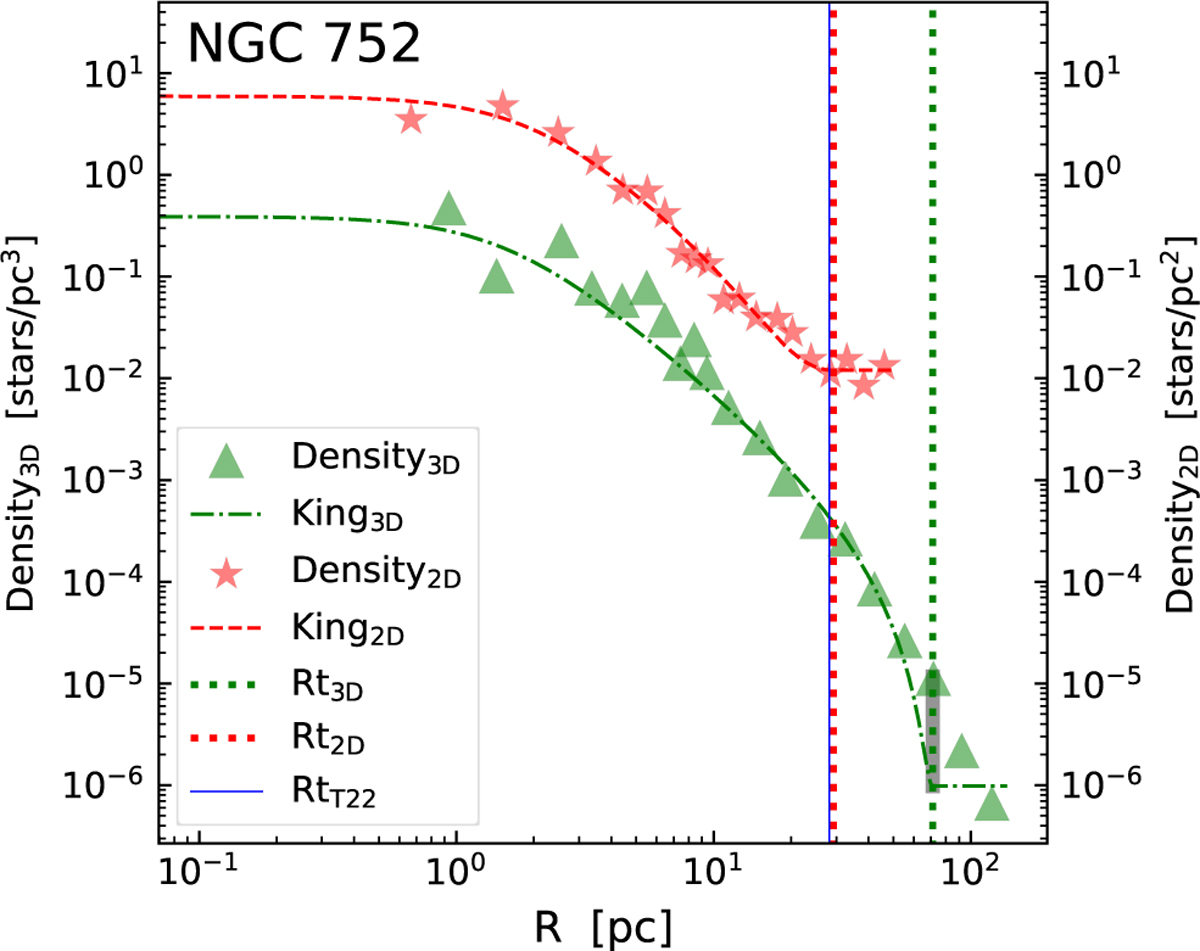
Three- and two-dimensional King profile fitting for the cluster NGC 752. The X-axis represents the radial distance from the cluster center, the left Y-axis corresponds to the 3D density, and the right Y-axis corresponds to the 2D density. The pink stars, dashed line, and vertical dotted line indicate the observed 2D number density, the fitted King profile, and the corresponding tidal radius, respectively. Similarly, the green triangles, the dot-dashed line, and the vertical dotted line represent the 3D counterparts. For comparison, we overplot the tidal radius given by T22 as a blue solid vertical line. The deviation of the data from the 3D King profile at the tidal radius is highlighted with a dark green vertical shaded region.
Current usage metrics show cumulative count of Article Views (full-text article views including HTML views, PDF and ePub downloads, according to the available data) and Abstracts Views on Vision4Press platform.
Data correspond to usage on the plateform after 2015. The current usage metrics is available 48-96 hours after online publication and is updated daily on week days.
Initial download of the metrics may take a while.