Fig. 2
Download original image
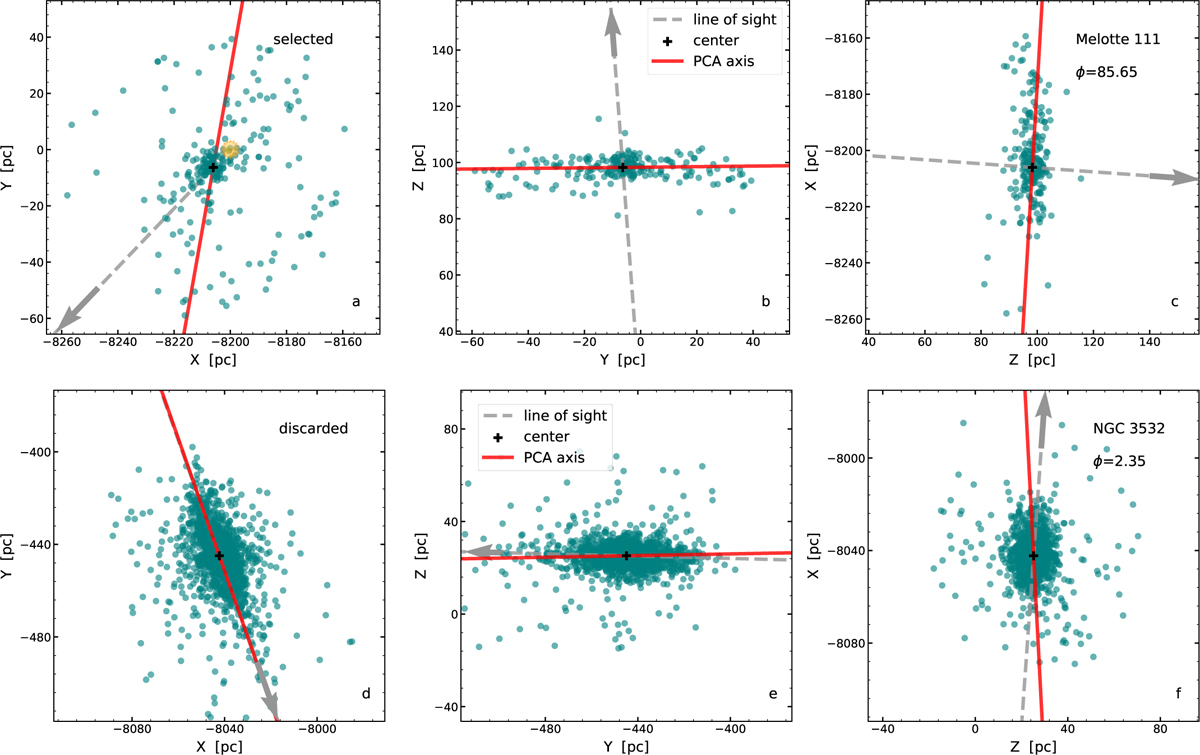
Examples of cluster morphology in Galactocentric Cartesian coordinates. The upper panel shows Melotte 111 (a high-ϕ cluster), while the lower panel illustrates NGC 3532 (a low-ϕ example). The red lines denote the projection of the first principal PCA axis in 3D, and the gray dashed lines represent the solar position to the cluster center (marked by the black cross).
Current usage metrics show cumulative count of Article Views (full-text article views including HTML views, PDF and ePub downloads, according to the available data) and Abstracts Views on Vision4Press platform.
Data correspond to usage on the plateform after 2015. The current usage metrics is available 48-96 hours after online publication and is updated daily on week days.
Initial download of the metrics may take a while.