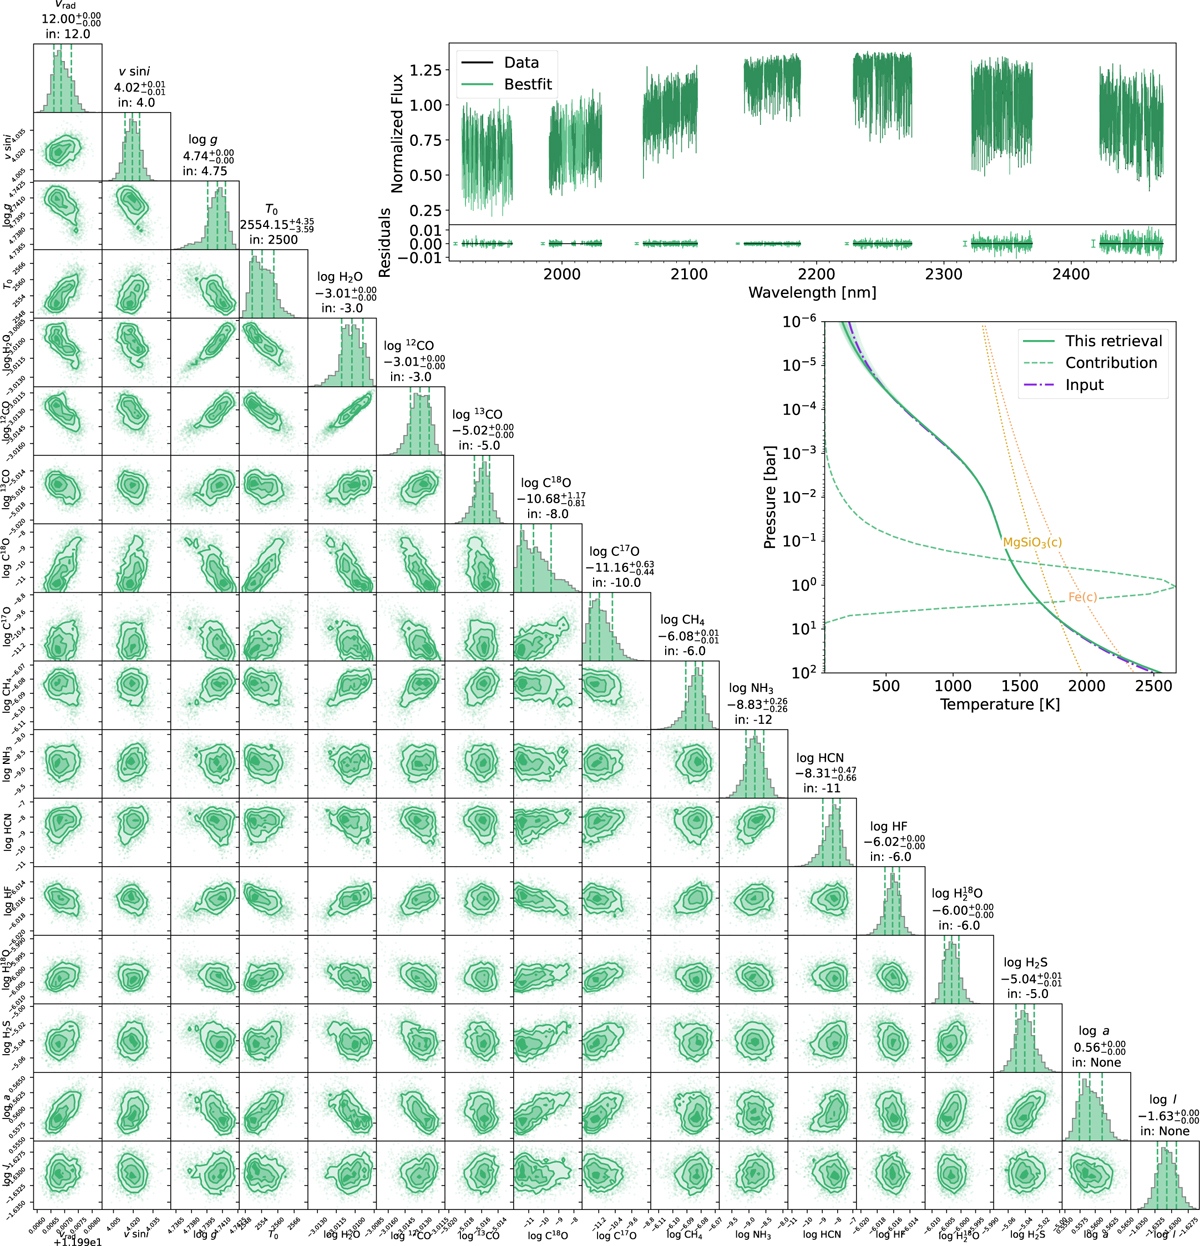
Fig. A.1
Download original image
Summary of the validation retrieval on a synthetic test spectrum. Top right: Best-fit spectrum (green) compared to the input spectrum (black), including their residuals (bottom panel). Middle right: Retrieved P-T profile (green) compared to the input P-T profile (purple). Bottom left: Retrieved posterior distributions of the free parameters. Parameter names in the titles on the diagonal, with the retrieved values underneath, and the input value (signified with “in:”) underneath.
Current usage metrics show cumulative count of Article Views (full-text article views including HTML views, PDF and ePub downloads, according to the available data) and Abstracts Views on Vision4Press platform.
Data correspond to usage on the plateform after 2015. The current usage metrics is available 48-96 hours after online publication and is updated daily on week days.
Initial download of the metrics may take a while.