Fig. 5
Download original image
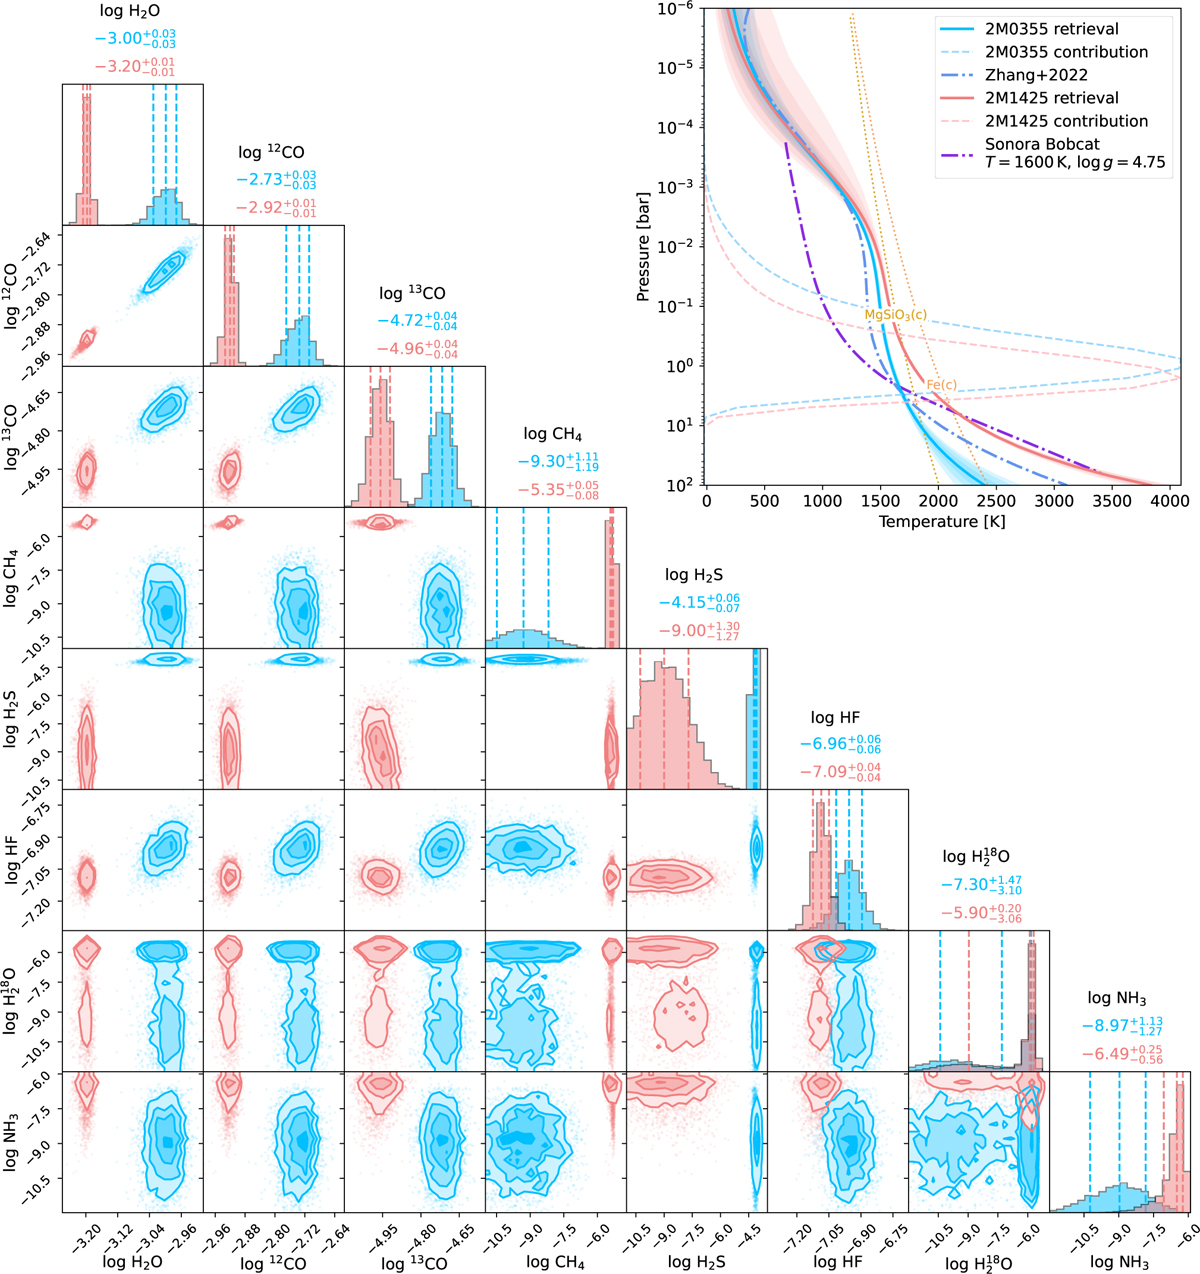
Retrieval results showing the posterior distributions of atmospheric species and the thermal structure of 2M0355 (blue) and 2M1425 (pink). Upper right panel: P–T profiles (solid lines) and their 68, 95, and 99.7% confidence intervals (shaded regions around them). The integrated emission contribution function for both objects are shown in their respective colors as vertical intensity functions on the pressure axis. A solar-metallicity Sonora Bobcat P–T profile (Teff = 1600 K, log g = 4.75) is shown in purple for comparison (Marley et al. 2021). The P–T profile retrieved for 2M0355 by Zhang et al. (2022) is shown as a blue dashed-dotted line. The condensation curves of MgSiO3 and Fe (Visscher et al. 2010) are included as dotted lines. Lower left panels: Cornerplot displaying the retrieved posterior distributions of selected chemical species of 2M0355 and 2M1425. The median retrieved values, along with the 16th and 84th percentile, are shown as vertical dashed lines.
Current usage metrics show cumulative count of Article Views (full-text article views including HTML views, PDF and ePub downloads, according to the available data) and Abstracts Views on Vision4Press platform.
Data correspond to usage on the plateform after 2015. The current usage metrics is available 48-96 hours after online publication and is updated daily on week days.
Initial download of the metrics may take a while.