Fig. 7
Download original image
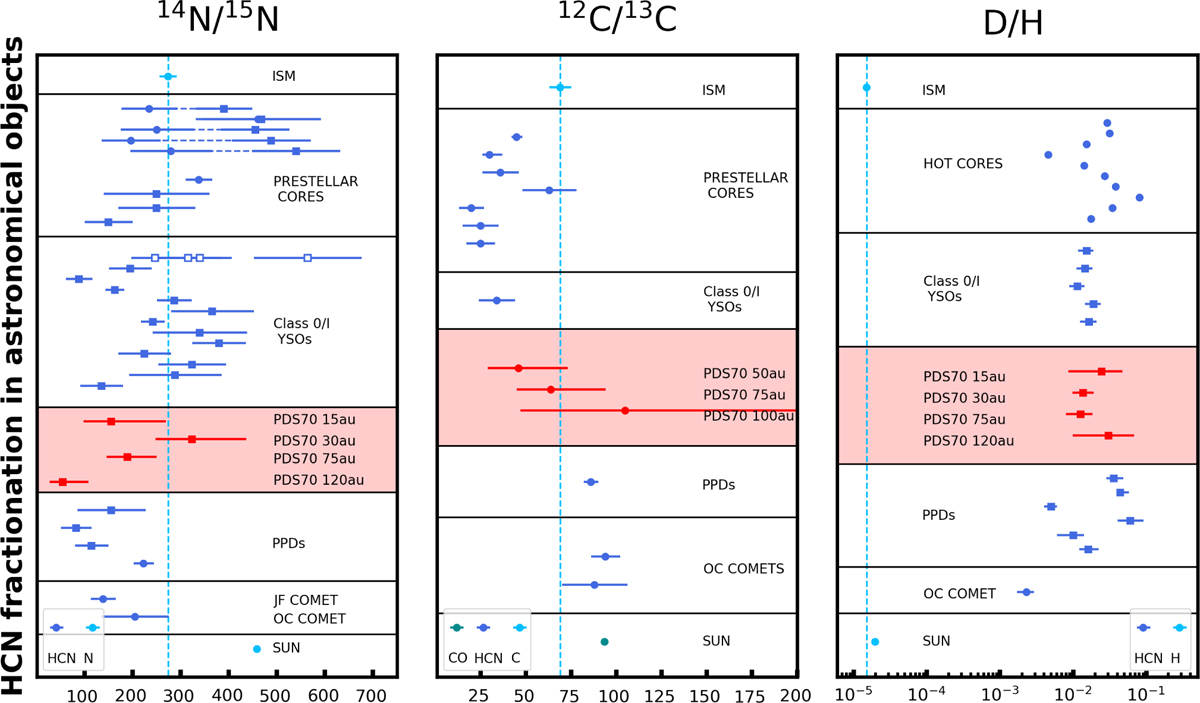
Nitrogen, carbon, and hydrogen fractionation in various astronomical objects. The red and dark blue markers indicate the isotope ratios of HCN, and the red dots refer to values extracted at different radii for the PDS 70 disk in this work. The light blue markers show the isotopic ratios. The green marker in the middle panel for the Sun is obtained from CO. The dashed light blue lines refer to the ISM isotopic ratios (Linsky et al. 2006; Wilson 1999; Ritchey et al. 2015). No error bars are displayed when the uncertainty was too low to be visible in the plot. The squares indicate indirect measurements of DCN/HCN and HCN/HC15N ratios, assuming a fixed 12C/13C, and circles refer to results obtained directly from the main isotopolog HCN (see Appendix F for references for the values presented here and related methods). For a few sources, both direct and indirect estimates are available and are displayed in the same row, connected by dashed horizontal lines. The aligned empty squares refer to the ratios we extracted for the same source, but in different regions.
Current usage metrics show cumulative count of Article Views (full-text article views including HTML views, PDF and ePub downloads, according to the available data) and Abstracts Views on Vision4Press platform.
Data correspond to usage on the plateform after 2015. The current usage metrics is available 48-96 hours after online publication and is updated daily on week days.
Initial download of the metrics may take a while.