Fig. 6
Download original image
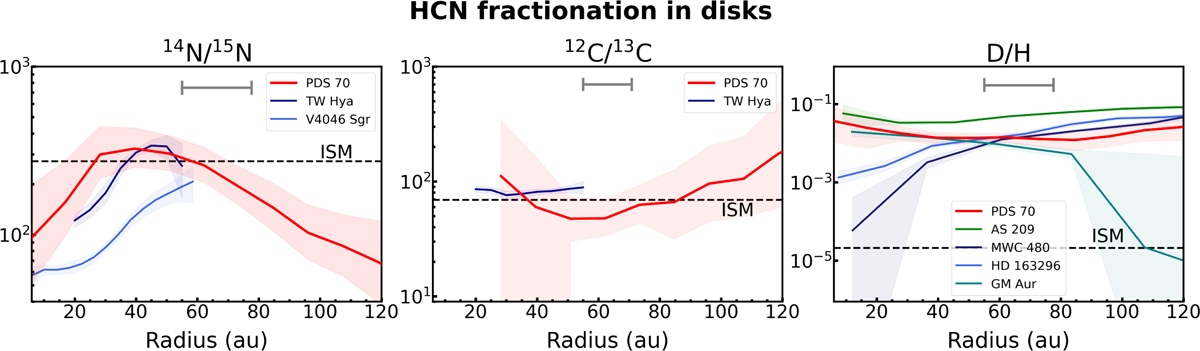
Radial profiles of the nitrogen, carbon, and hydrogen fractionation of HCN in disks. The red profiles in the three panels show the results for the PDS 70 disk (solid lines and ribbons show the 50th, 16th, and 84th percentiles of the posterior distributions, respectively), and the horizontal dashed lines indicate the ISM values (Nomura et al. 2023; Ritchey et al. 2015; Wilson 1999; Linsky et al. 2006). The isotopic ratios profiles for the PDS 70 disk are compared to those for the TW Hya (Hily-Blant et al. 2019) and V4046 Sgr disks (Nomura et al. 2023, Guzmán et al., in prep.) for nitrogen in the left panel, the TW Hya disk (Hily-Blant et al. 2019) for carbon in the middle panel, and to the disks in the MAPS survey (Cataldi et al. 2021) for hydrogen in the right panel. The nitrogen and hydrogen fractionation profiles are obtained by converting the H13CN into an HCN column density, assuming a fixed 12C/13C = 69 ratio. The gray line at the top of each panel shows the major axis of the beam of the observations we used to extract the profiles for the PDS 70 disk.
Current usage metrics show cumulative count of Article Views (full-text article views including HTML views, PDF and ePub downloads, according to the available data) and Abstracts Views on Vision4Press platform.
Data correspond to usage on the plateform after 2015. The current usage metrics is available 48-96 hours after online publication and is updated daily on week days.
Initial download of the metrics may take a while.