Fig. 5
Download original image
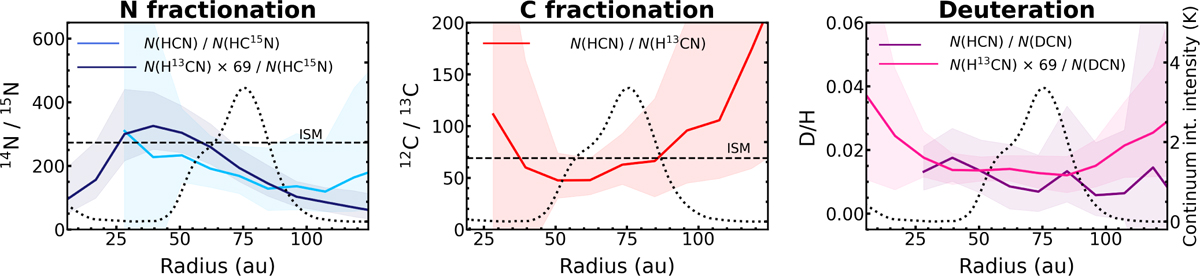
Nitrogen, carbon, and hydrogen fractionation of the HCN molecule. Left panel: 69 × H13CN/HC15N (dark blue) and HCN/HC15N (light blue) profiles. Middle panel: HCN/H13CN. Right panel: 69 × H13CN/DCN (pink) and HCN/DCN (purple) profiles. Ribbons show the 16th and 84th percentiles of the posterior distributions of isotopolog ratios. The dashed horizontal black lines show the ISM values of 14N/15N = 274 (blue) and of 12C/13C = 69, and the ISM values of D/H are not indicated because they are ~10−5 (see references in Nomura et al. 2023). The marker length in each legend shows the major axis of the beam of cubes we used to retrieve the corresponding profiles in the plots. The dotted black line shows the 855 μm continuum integrated-intensity profile (Isella et al. 2019; Benisty et al. 2021).
Current usage metrics show cumulative count of Article Views (full-text article views including HTML views, PDF and ePub downloads, according to the available data) and Abstracts Views on Vision4Press platform.
Data correspond to usage on the plateform after 2015. The current usage metrics is available 48-96 hours after online publication and is updated daily on week days.
Initial download of the metrics may take a while.