Fig. 3

Download original image
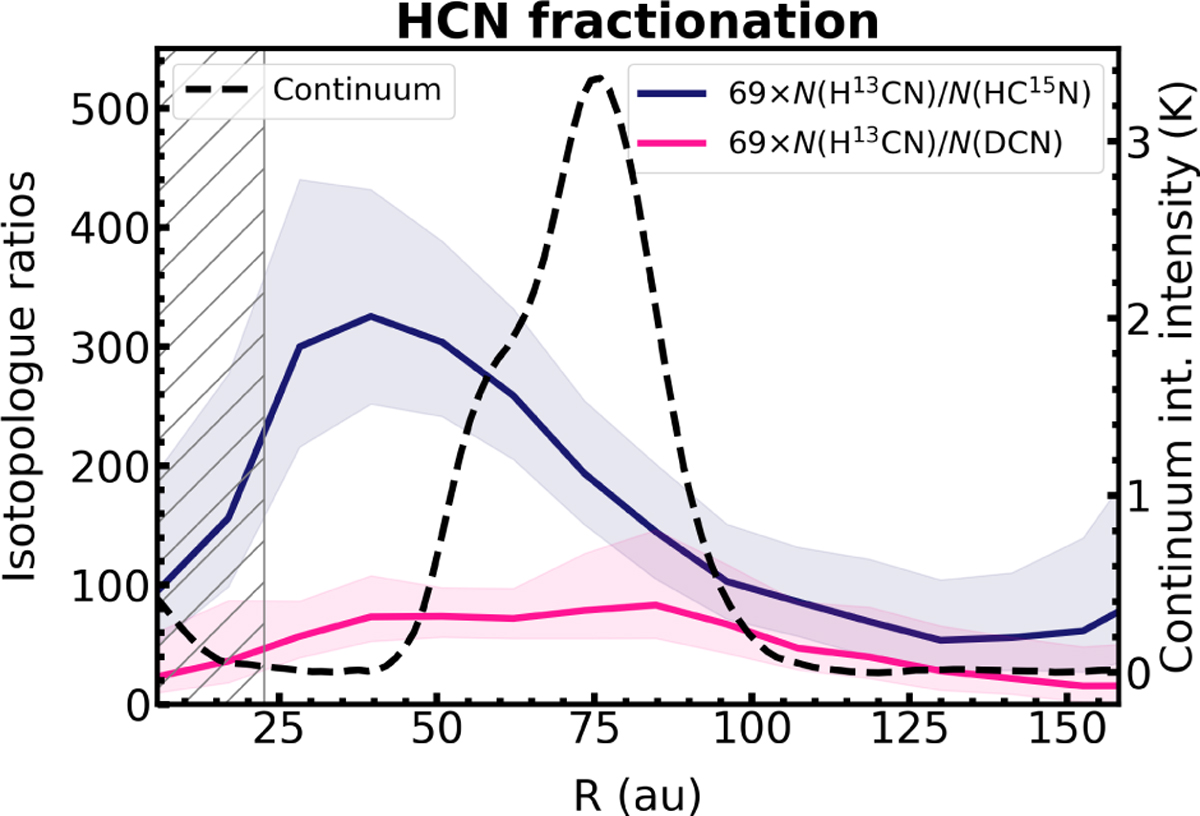
Nitrogen (blue) and hydrogen (pink) fractionation profiles of HCN in the PDS 70 disk, assuming a radially constant 12C/13C = 69 value to convert the H13CN column density into an HCN column density. The ribbons indicate the 16th and 84th percentiles of the posterior distribution of the ratios. The dashed black line shows the integrated-intensity profile of the 855 μm continuum observations (Isella et al. 2019; Benisty et al. 2021). The hatched regions indicate the beam major axis of the data cubes of HCN isotopologs.
Current usage metrics show cumulative count of Article Views (full-text article views including HTML views, PDF and ePub downloads, according to the available data) and Abstracts Views on Vision4Press platform.
Data correspond to usage on the plateform after 2015. The current usage metrics is available 48-96 hours after online publication and is updated daily on week days.
Initial download of the metrics may take a while.


