Fig. 2
Download original image
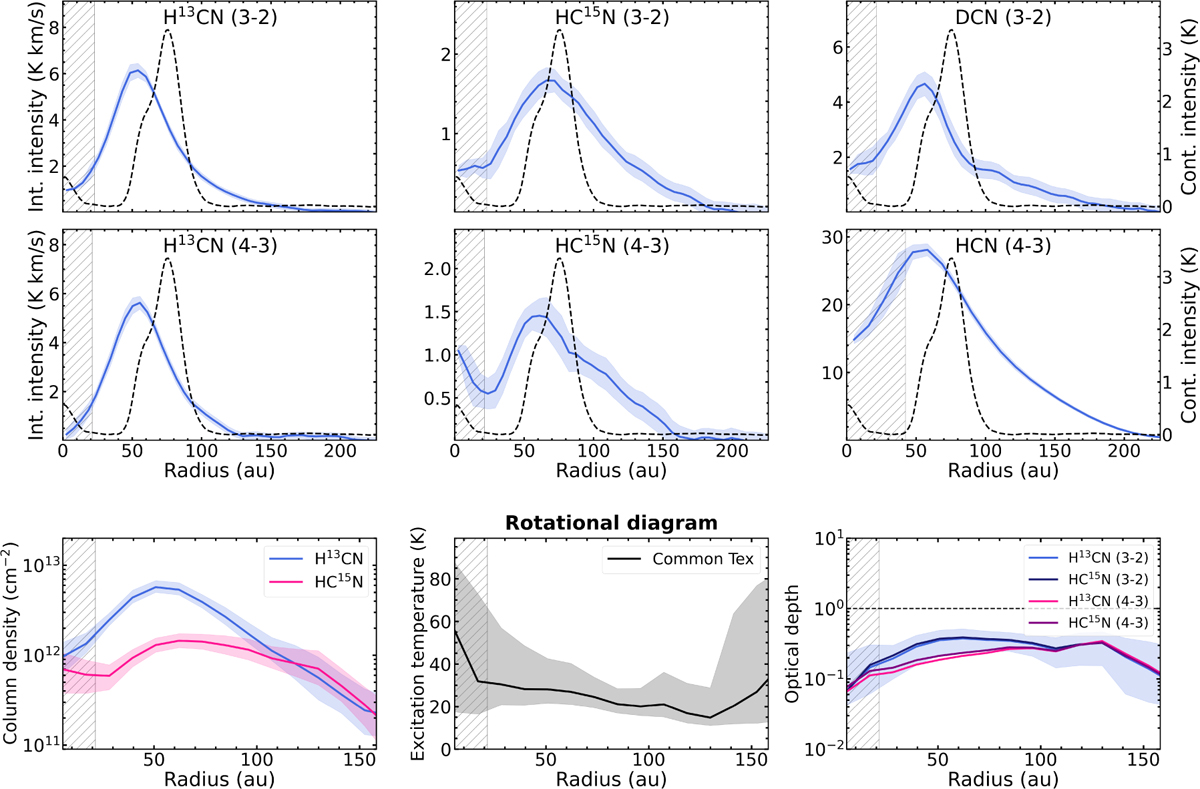
Top panels: integrated-intensity profiles of lines of HCN isotopologs. The ribbons show the standard deviation across each annulus, divided by the square root of the number of independent beams. The intensity is expressed in brightness temperature under the Rayleigh-Jeans approximation. The dashed black line is the integrated-intensity profile of the 855 μm continuum (Isella et al. 2019; Benisty et al. 2021). The hatched region shows the beam major axis of each line. Bottom row: results of the radial rotational diagram analysis. The solid lines in the left and middle panels show the 50th percentile of the column density profiles (H13CN in blue and HC15N in pink) and of the excitation temperature (black). The ribbons show the 16th and 84th percentiles of the posterior distributions. The right panel represents the radial profiles of the optical depth for the analyzed molecular lines of H13CN and HC15N, and the related uncertainty is shown for the H13CN (3–2) line for reference because it is representative of the typical uncertainty. The dashed black line shows the τ = 1 level.
Current usage metrics show cumulative count of Article Views (full-text article views including HTML views, PDF and ePub downloads, according to the available data) and Abstracts Views on Vision4Press platform.
Data correspond to usage on the plateform after 2015. The current usage metrics is available 48-96 hours after online publication and is updated daily on week days.
Initial download of the metrics may take a while.