Fig. 1
Download original image
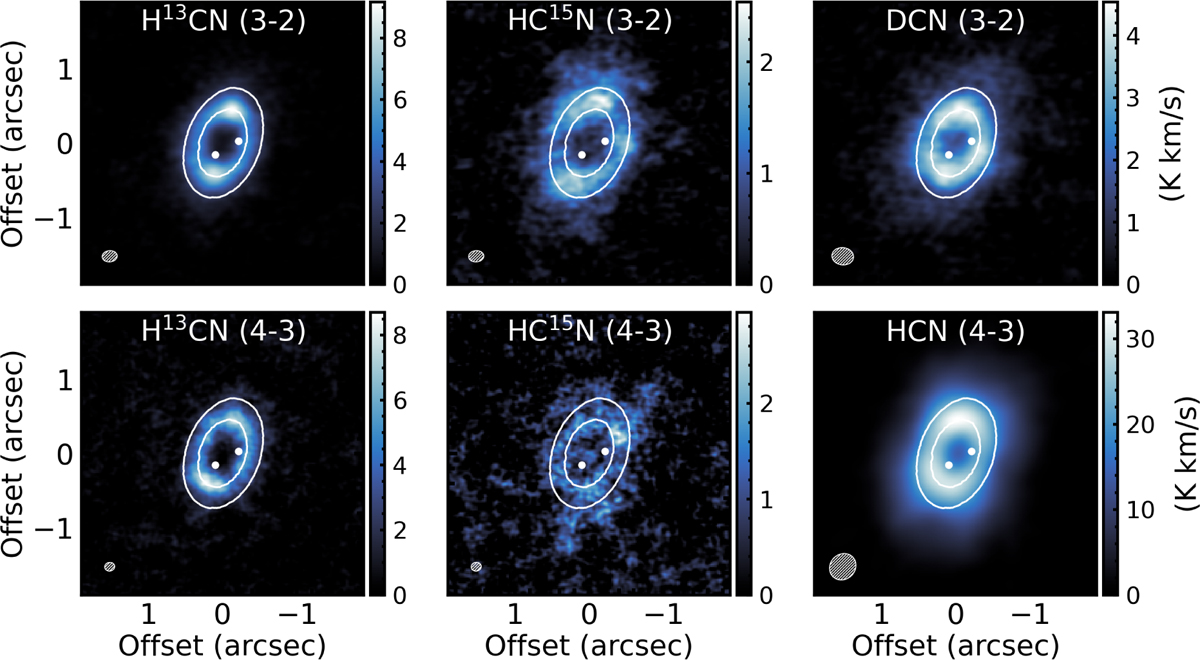
Integrated-intensity maps of HCN isotopologs in the PDS 70 disk. The brightness temperatures were obtained assuming the Rayleigh-Jeans approximation. The HCN (4–3) map in the bottom right panel was obtained from SB observations alone. The white contours show the bright ring in the submillimeter continuum emission (Isella et al. 2019), the white dots mark the position of the two forming planets (2020 astrometry data from Wang et al. 2021), and the gray ellipse in the bottom left corner of each panel shows the synthesized beam.
Current usage metrics show cumulative count of Article Views (full-text article views including HTML views, PDF and ePub downloads, according to the available data) and Abstracts Views on Vision4Press platform.
Data correspond to usage on the plateform after 2015. The current usage metrics is available 48-96 hours after online publication and is updated daily on week days.
Initial download of the metrics may take a while.