Fig. 9.
Download original image
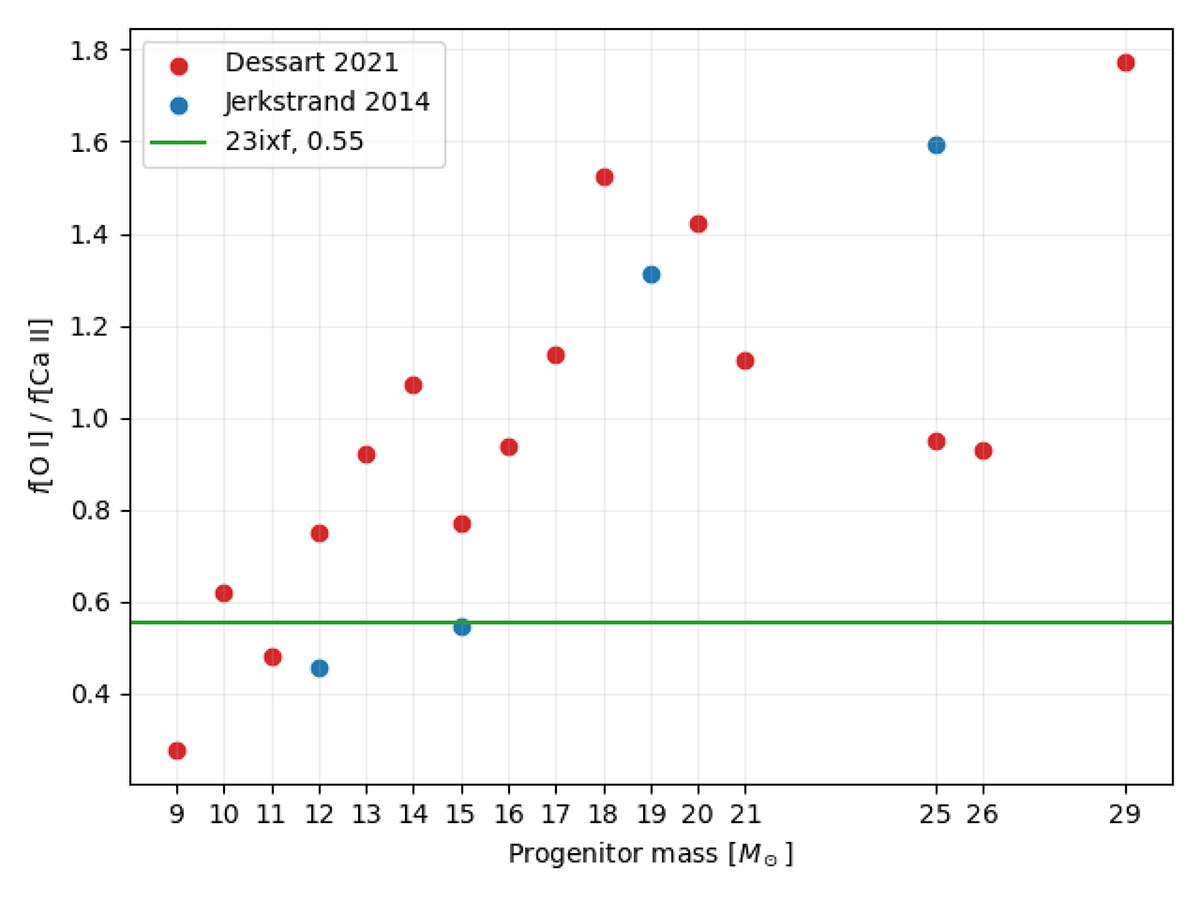
Flux ratio of the [O I] λλ 6300,6364 line to the [Ca II] λλ 7294,7321 line as measured in the 445 d spectrum of SN 2023ixf (horizontal green line) in comparison to the ratios measured based on the model spectra of various progenitor masses from Dessart et al. (2021) (red circles) and Jerkstrand et al. (2014) (blue circles). This comparison favors a progenitor mass in the range of about 10–15 M⊙.
Current usage metrics show cumulative count of Article Views (full-text article views including HTML views, PDF and ePub downloads, according to the available data) and Abstracts Views on Vision4Press platform.
Data correspond to usage on the plateform after 2015. The current usage metrics is available 48-96 hours after online publication and is updated daily on week days.
Initial download of the metrics may take a while.