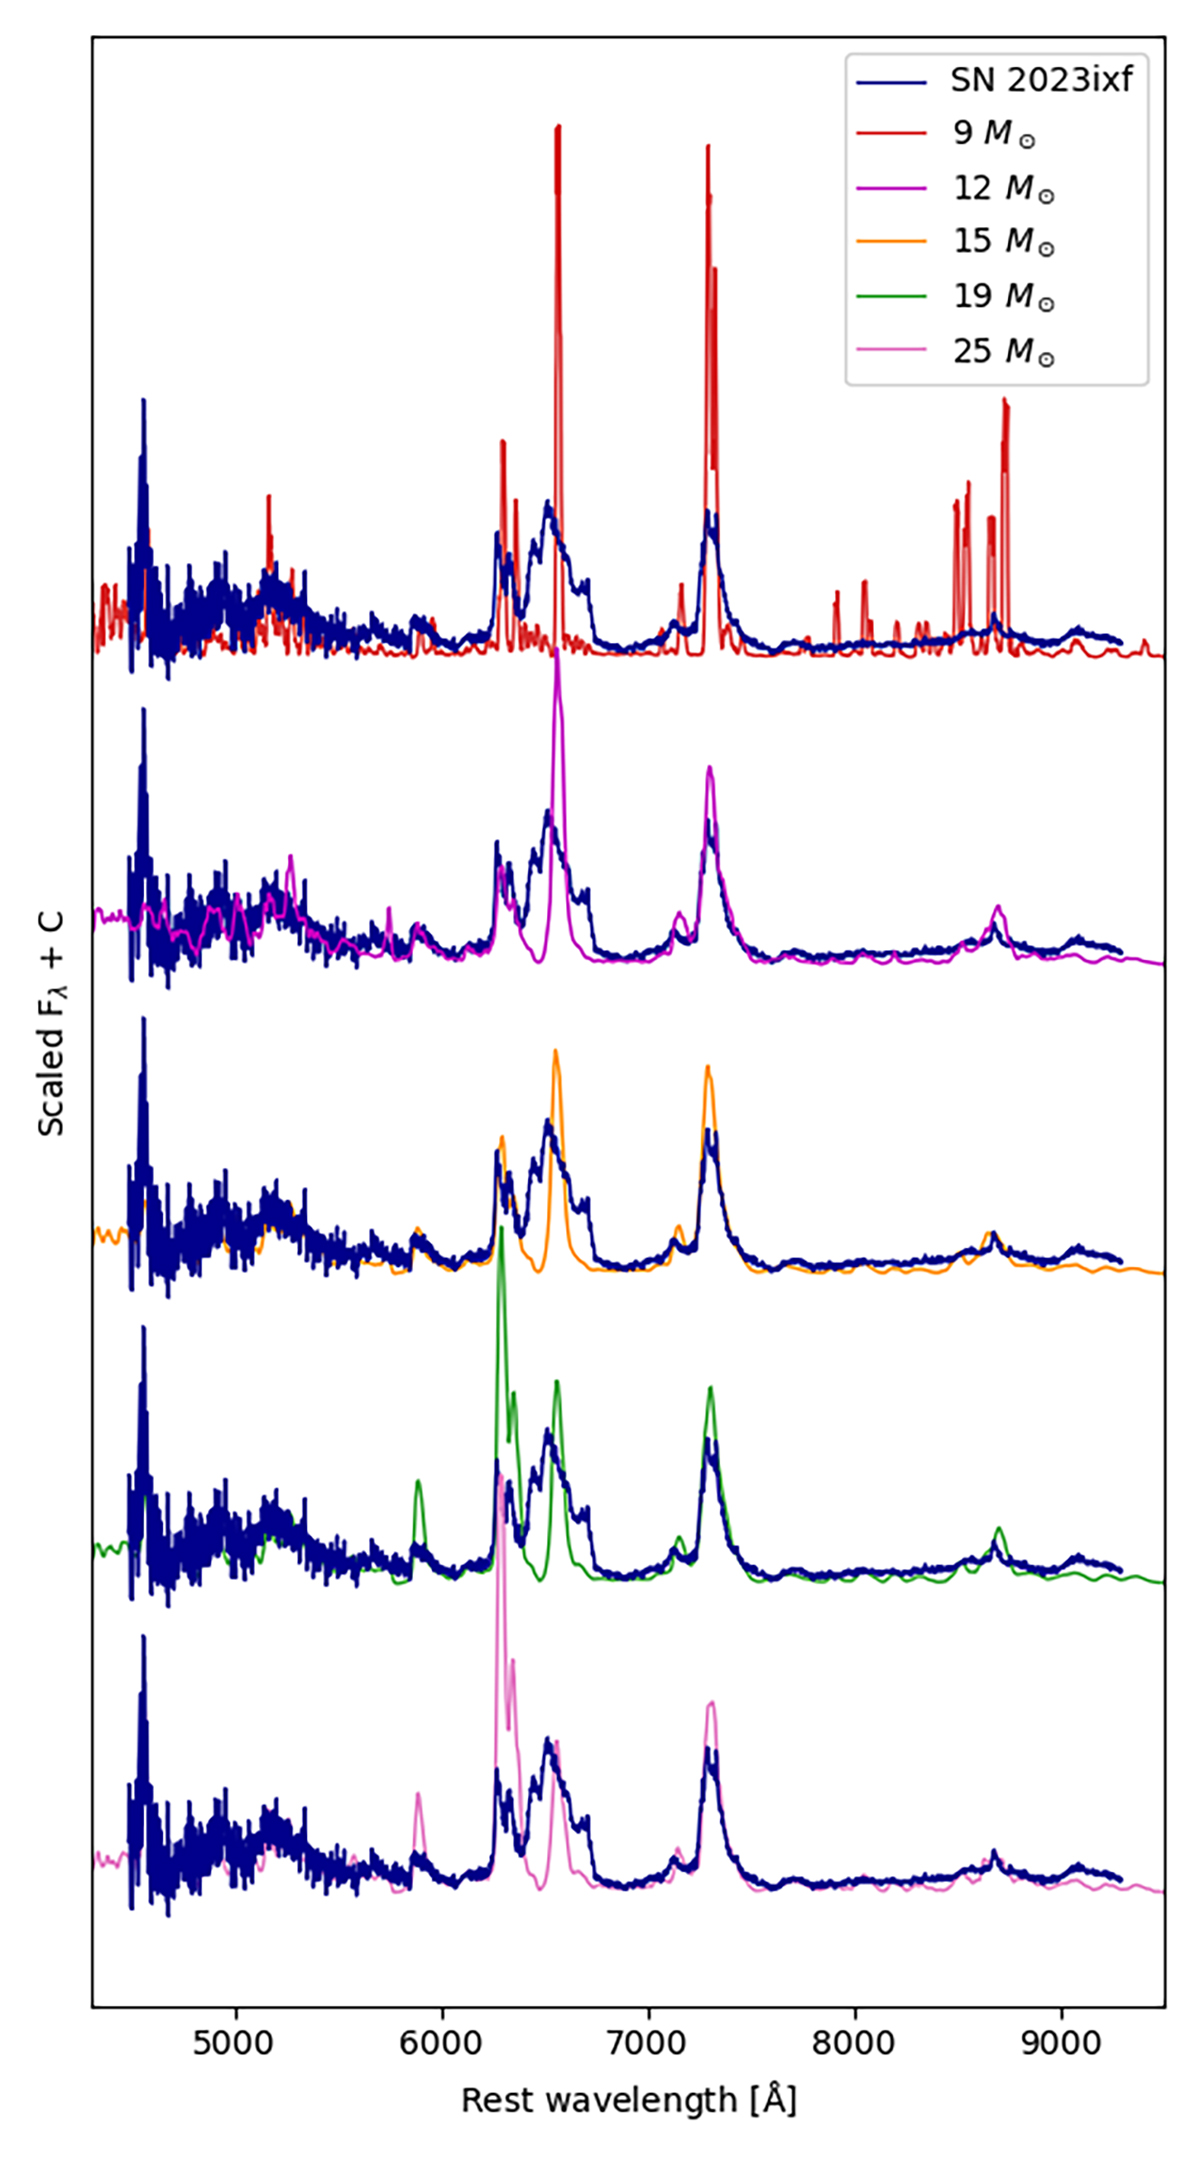
Fig. 8.
Download original image
Similar to Figure 7, but for the 445 d spectrum (blue lines), compared to radiative transfer calculations of SN II spectra at 450 days for progenitors of various initial masses (colored lines as labeled). Models for 9 M⊙ are from Jerkstrand et al. (2018), while models for the other masses are from Jerkstrand et al. (2014). The model spectra were normalized to match the observed flux integrated between 6900 and 8200 Å.
Current usage metrics show cumulative count of Article Views (full-text article views including HTML views, PDF and ePub downloads, according to the available data) and Abstracts Views on Vision4Press platform.
Data correspond to usage on the plateform after 2015. The current usage metrics is available 48-96 hours after online publication and is updated daily on week days.
Initial download of the metrics may take a while.