Fig. 1.
Download original image
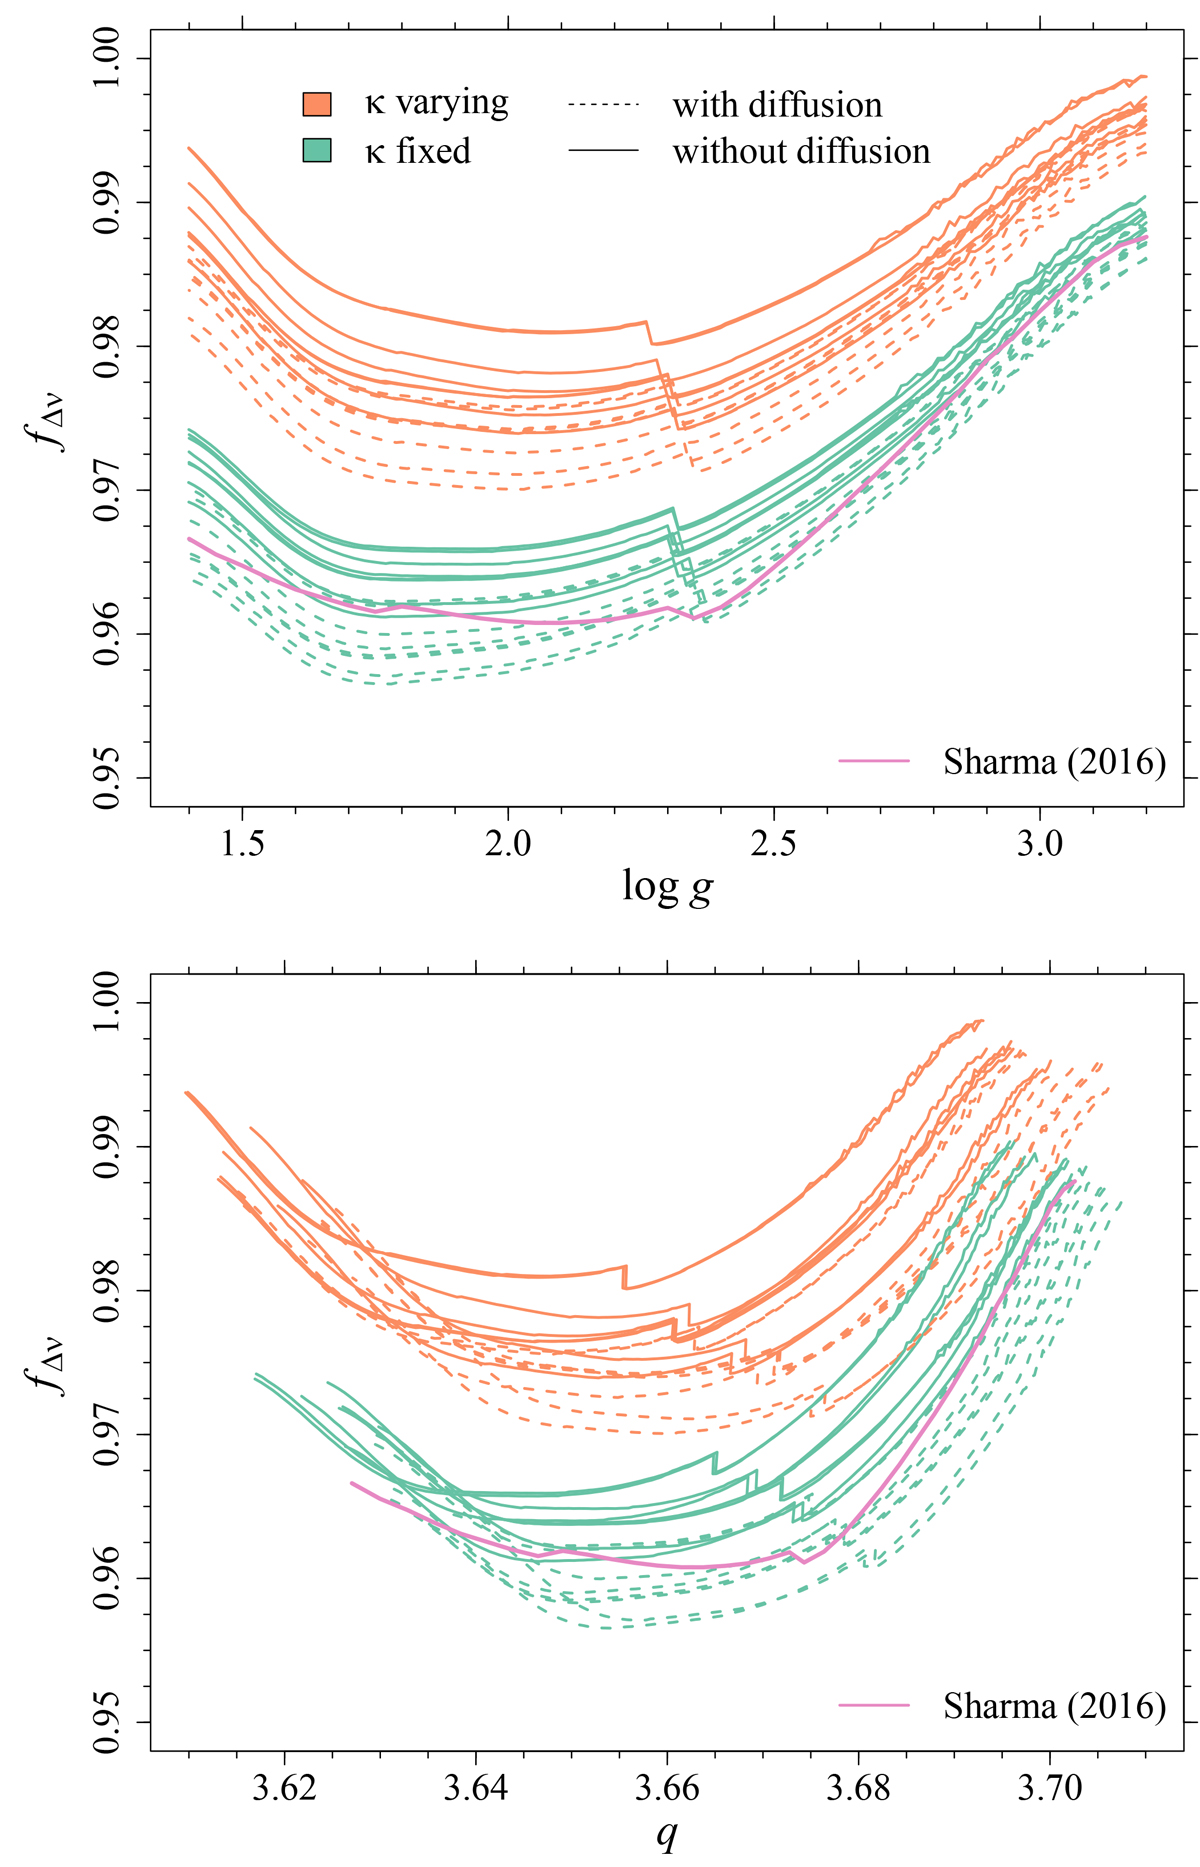
Evolution of the fΔν ratio for the 32 parameter combinations considered. Top panel: trend of fΔν vs. log g. The solid violet line indicates the reference model with M = 1.0 M⊙, Z = 0.00477, based on the Sharma et al. (2016) data set. Different colours represent models with varying (orange) and fixed (green) opacity κ in the atmosphere, the primary source of systematic uncertainty in fΔν. Line styles differentiate models calculated with (dashed) and without (solid) microscopic diffusion, which is the second most significant contributor to systematic uncertainty in fΔν. Bottom panel: same as the top panel, but shown as a function of the q parameter.
Current usage metrics show cumulative count of Article Views (full-text article views including HTML views, PDF and ePub downloads, according to the available data) and Abstracts Views on Vision4Press platform.
Data correspond to usage on the plateform after 2015. The current usage metrics is available 48-96 hours after online publication and is updated daily on week days.
Initial download of the metrics may take a while.