Fig. 8
Download original image
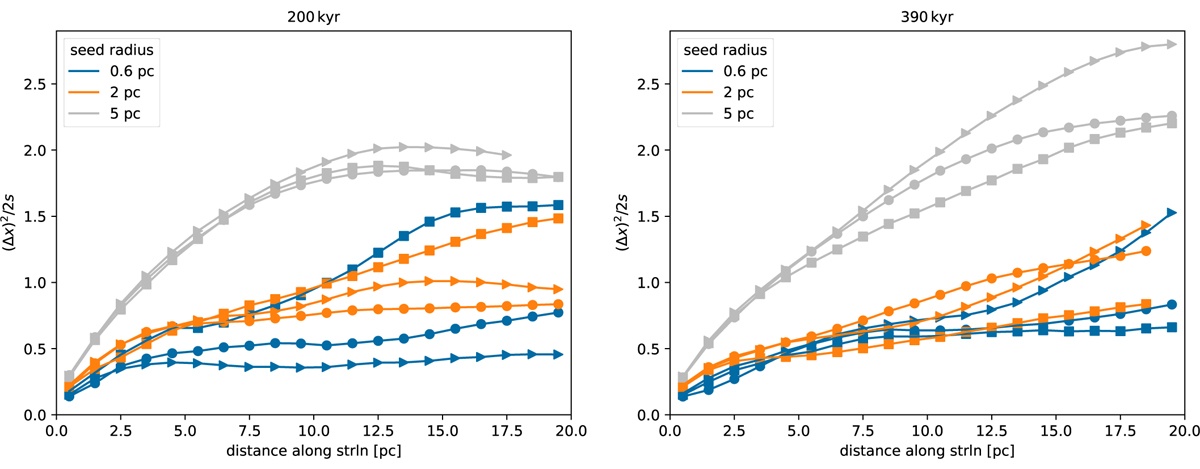
Streamline diffusivity for seed points placed within spheres of the indicated radii at 200 kyr (left) and 390 kyr (right). Triangles, circles, and squares indicate clusters I, II, and III, respectively. The near linear increase for the 5 pc seed cloud radius is due to quasi-radial field-line bundles embedded in transonic sheets (cf. Fig. 5, lower panel) and the levelling-off is due to fieldlines travelling close to the superbubble edge looping back to the core. The variation between clusters I and II, which only differ in the spatial distribution of stars, illustrates the importance of local wind interactions.
Current usage metrics show cumulative count of Article Views (full-text article views including HTML views, PDF and ePub downloads, according to the available data) and Abstracts Views on Vision4Press platform.
Data correspond to usage on the plateform after 2015. The current usage metrics is available 48-96 hours after online publication and is updated daily on week days.
Initial download of the metrics may take a while.