Fig. 6
Download original image
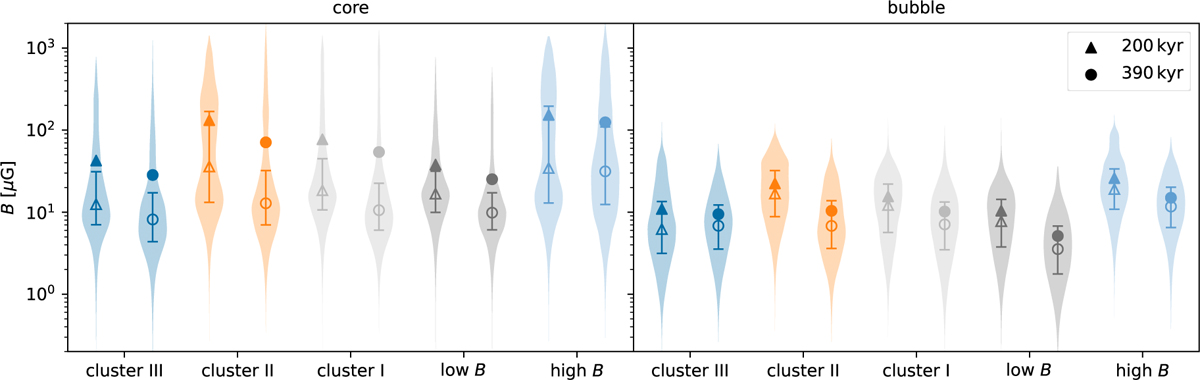
Magnetic field in the cluster core (left) and superbubble interior (right). Triangles mark distributions before the WR onset at 200 kyr, and circles indicate distributions after the WR onset at 390 kyr. Colours indicate different simulation runs (see Table 1 for run parameters). Filled markers show the mean, empty markers the median. Whiskers indicate the 25th and 75th percentiles. Asymmetries due to local wind interactions are larger in the core, as evident by the broader distributions, but are reduced when the flow reaches the superbubble. We note that the distributions are shown in log space.
Current usage metrics show cumulative count of Article Views (full-text article views including HTML views, PDF and ePub downloads, according to the available data) and Abstracts Views on Vision4Press platform.
Data correspond to usage on the plateform after 2015. The current usage metrics is available 48-96 hours after online publication and is updated daily on week days.
Initial download of the metrics may take a while.