Fig. 3
Download original image
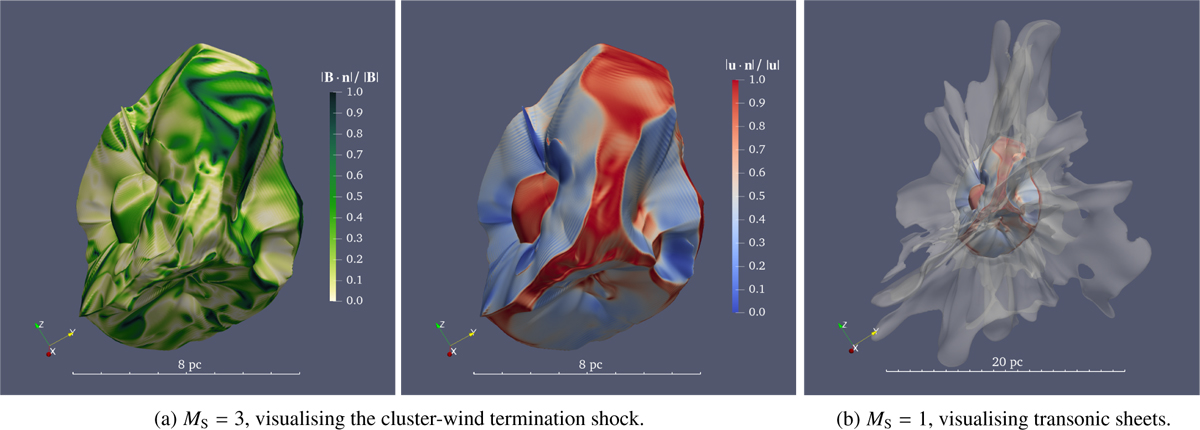
Surfaces of constant sonic Mach number visualising (a) the cluster-wind termination shock and (b) transonic sheets. The two panels in (a) show the orientation of the magnetic field, B (left), and the flow velocity, u (right), with respect to the Mach surface normal, n. In the latter plot, cones (blue, dominated by perpendicular flow) can be clearly distinguished from sheet base shocks (red, inbetween adjacent cones) and coupled stellar winds (red, in the centre of cones). In panel b, the MS = 1 surface is over-plotted onto the MS = 3 surface surface in transparent white, highlighting that sheets extend outward from regions of parallel flow. The panels show cluster I at 390 kyr.
Current usage metrics show cumulative count of Article Views (full-text article views including HTML views, PDF and ePub downloads, according to the available data) and Abstracts Views on Vision4Press platform.
Data correspond to usage on the plateform after 2015. The current usage metrics is available 48-96 hours after online publication and is updated daily on week days.
Initial download of the metrics may take a while.