Fig. 1
Download original image
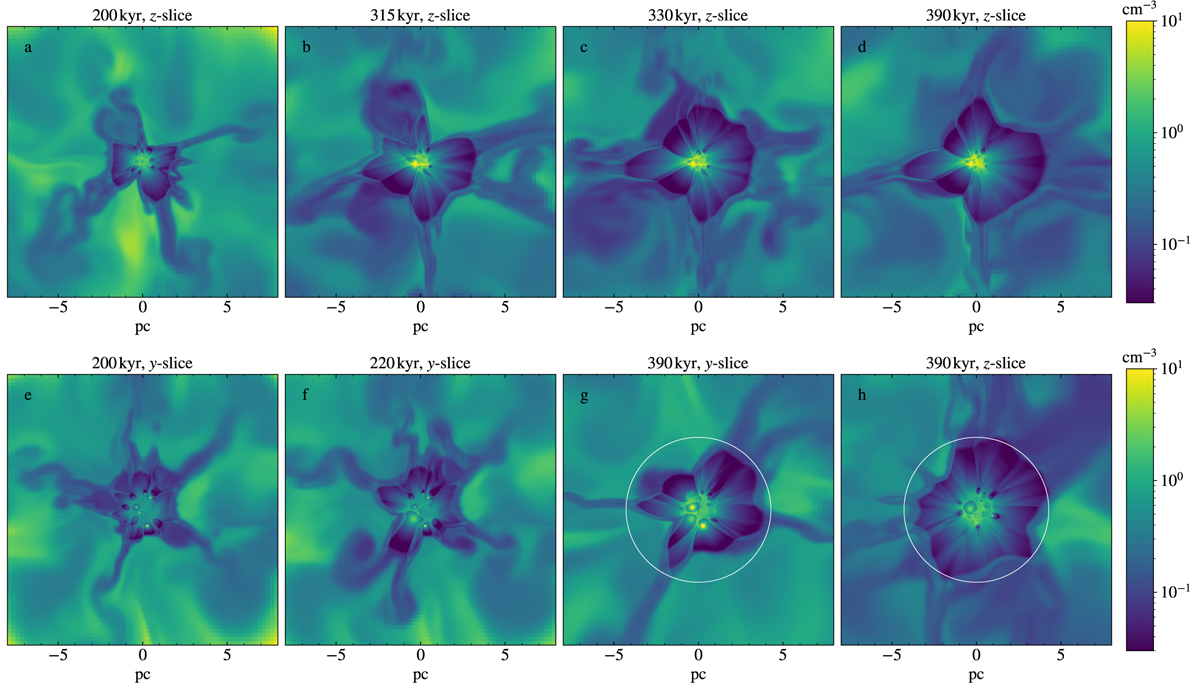
Density slices for cluster I (Rc = 0.6 pc, top) and cluster III (Rc = 1 pc, bottom). The inner ±8 pc are shown, which excludes the superbubble shell. In the left-most panels (a and e), all stars are on the main sequence. The cluster wind is in a quasi-stationary state, slowly expanding over time but not changing geometry. At t > 200 kyr (panels b–d and f–h), the most massive stars consecutively evolve into WR stars. The flow rearranges into a new quasi-stationary state within ~20 kyr after each new WR wind (see panels b–c and e–f). The wind termination shock has a complex, non-spherical geometry, which appears different in different slices (see panels g–h). The white circle in panels g–h indicates the shock radius predicted by 1D analytical theory (Weaver et al. 1977).
Current usage metrics show cumulative count of Article Views (full-text article views including HTML views, PDF and ePub downloads, according to the available data) and Abstracts Views on Vision4Press platform.
Data correspond to usage on the plateform after 2015. The current usage metrics is available 48-96 hours after online publication and is updated daily on week days.
Initial download of the metrics may take a while.