Fig. 3
Download original image
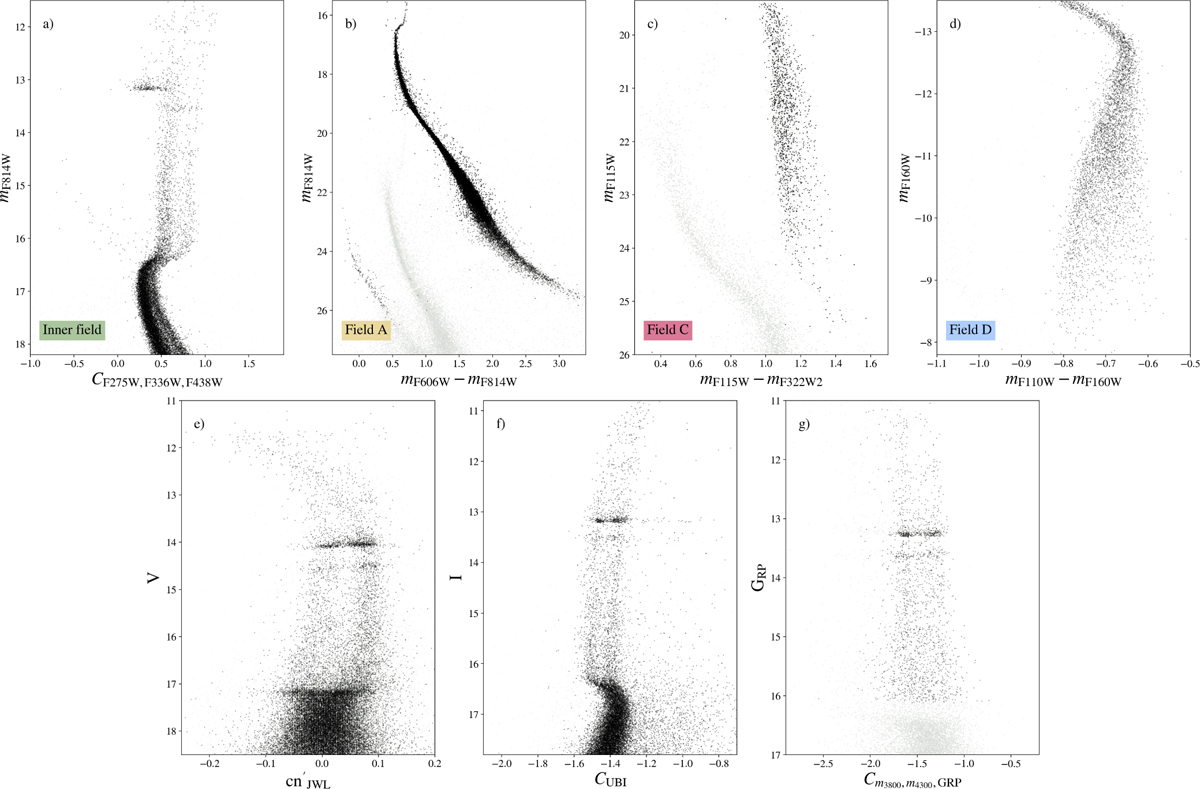
Photometric diagrams demonstrating the photometry used to disentangle the multiple populations in different radial regions of 47 Tucanae. Panel a shows the HST UV photometry used to identify populations in the RGB. In panel b, we show the CMD created using HST optical filters for Field A. Panel c demonstrates the CMD created for the lower MS and substellar objects with JWST filters for Field C. Panel d displays HST IR photometry for disentangling populations among the lower MS. In panel e, we show Ca-CN photometry by Lee (2022), which is effective in identifying populations among RGB and HB stars. Panel f displays the diagram with ground-based UBVI photometry from Stetson et al. (2019). Finally, in panel g), we show the CMD created with Gaia XP spectro-photometry (Mehta et al. 2025)
Current usage metrics show cumulative count of Article Views (full-text article views including HTML views, PDF and ePub downloads, according to the available data) and Abstracts Views on Vision4Press platform.
Data correspond to usage on the plateform after 2015. The current usage metrics is available 48-96 hours after online publication and is updated daily on week days.
Initial download of the metrics may take a while.