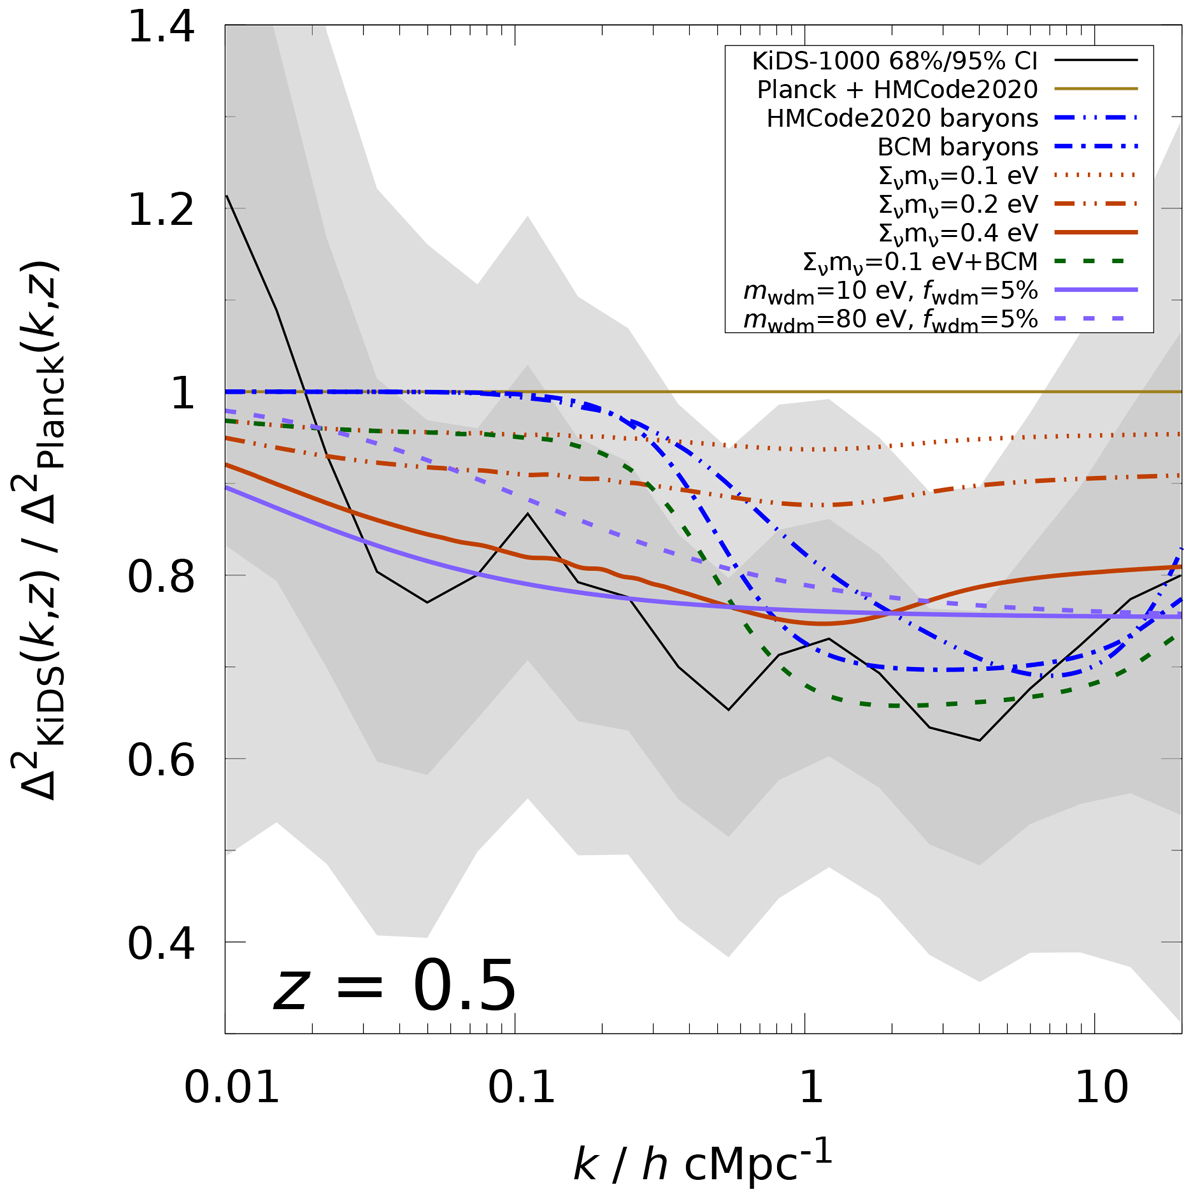
Fig. 8.
Download original image
Power spectrum ratio ΔKiDS2(k, z)/ΔPlanck2(k, z) at z = 0.5. Shown in grey are the 68% and 95% CI from our analysis. The KiDS-1000 spectrum ΔKiDS2(k, z) uses the fδ, mn in Fig. 4 averaged within one broad redshift bin (left panel). The Planck model for ΔPlanck2(k, z) is the TT, TE, EE+lowE best fit of a standard ΛCDM (Planck Collaboration VI 2020) extrapolated to z = 0.5 with HMCode2020 by Mead et al. (2021). The lines are model transfer functions to ΔPlanck2(k, z) invoking flavours of extreme baryonic feedback (HMCode2020: log10(TAGN/K) = 8.8, Abaryon = 3.13, ηbaryon = 0.603; BCM by Schneider & Teyssier 2015: log10(Mc/h−1 M⊙) = 15.0792, ηb = 0.5, ks = 55.0), neutrino suppression for cumulative neutrino masses ∑νmν (BCM), or a mixture of CDM and WDM (Kamada et al. 2016, mwdm: WDM particle mass, fwdm: WDM mass fraction).
Current usage metrics show cumulative count of Article Views (full-text article views including HTML views, PDF and ePub downloads, according to the available data) and Abstracts Views on Vision4Press platform.
Data correspond to usage on the plateform after 2015. The current usage metrics is available 48-96 hours after online publication and is updated daily on week days.
Initial download of the metrics may take a while.