Fig. 5.
Download original image
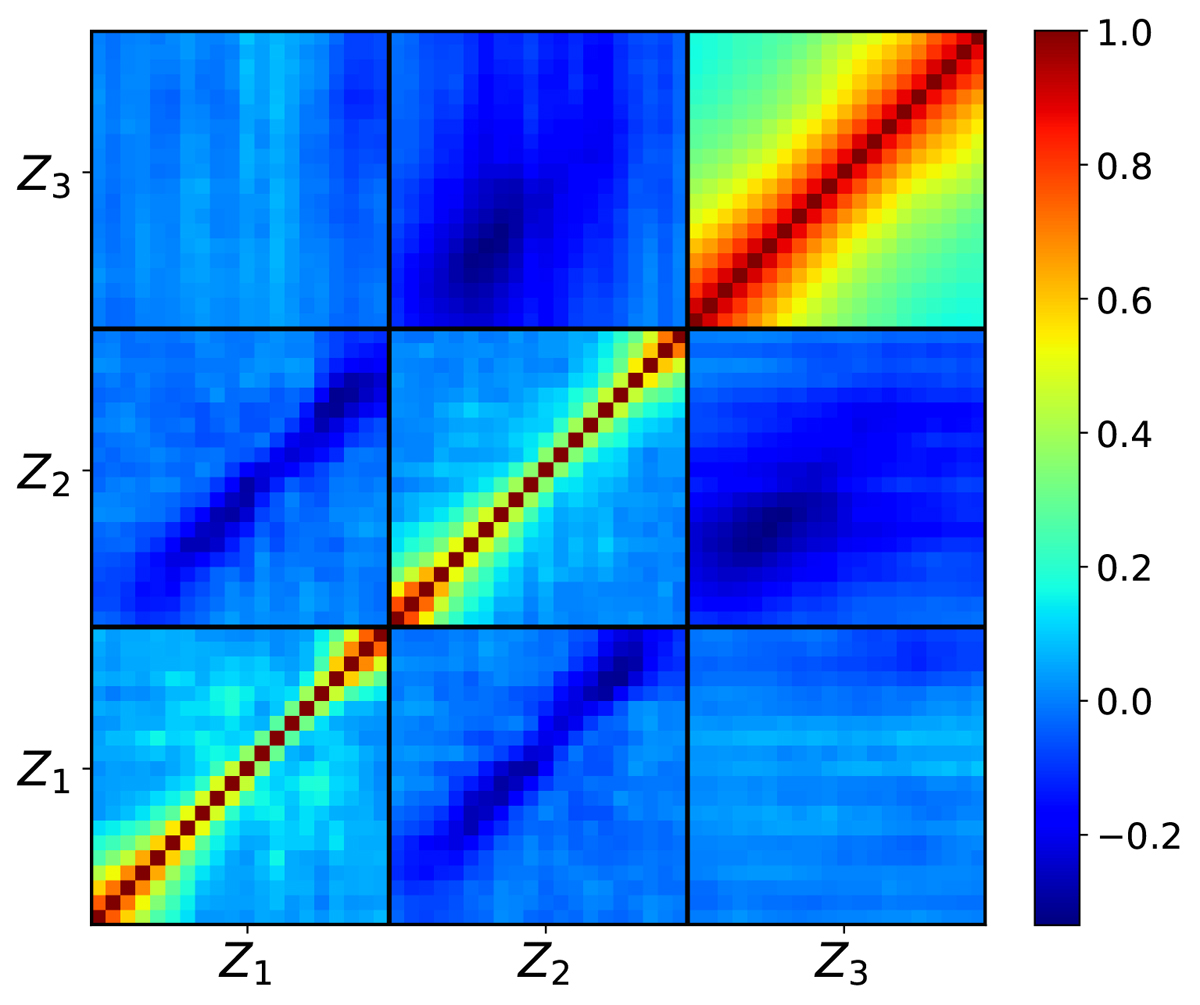
Correlation matrix of fδ, mn errors for the KiDS-1000 analysis with three redshift bins, corresponding to the middle and right panels in Fig. 4. The three blocks on the diagonal from bottom left to top right are the correlation matrices for the z-bins Z1 = [0, 0.3], Z2 = [0.3, 0.6], Z3 = [0.6, 2], respectively; off-diagonal blocks show correlations between distinct z-bins; pixels within the 20 × 20 blocks are correlations between the k-bins, ascending from left to right inside a block.
Current usage metrics show cumulative count of Article Views (full-text article views including HTML views, PDF and ePub downloads, according to the available data) and Abstracts Views on Vision4Press platform.
Data correspond to usage on the plateform after 2015. The current usage metrics is available 48-96 hours after online publication and is updated daily on week days.
Initial download of the metrics may take a while.