Fig. 3.
Download original image
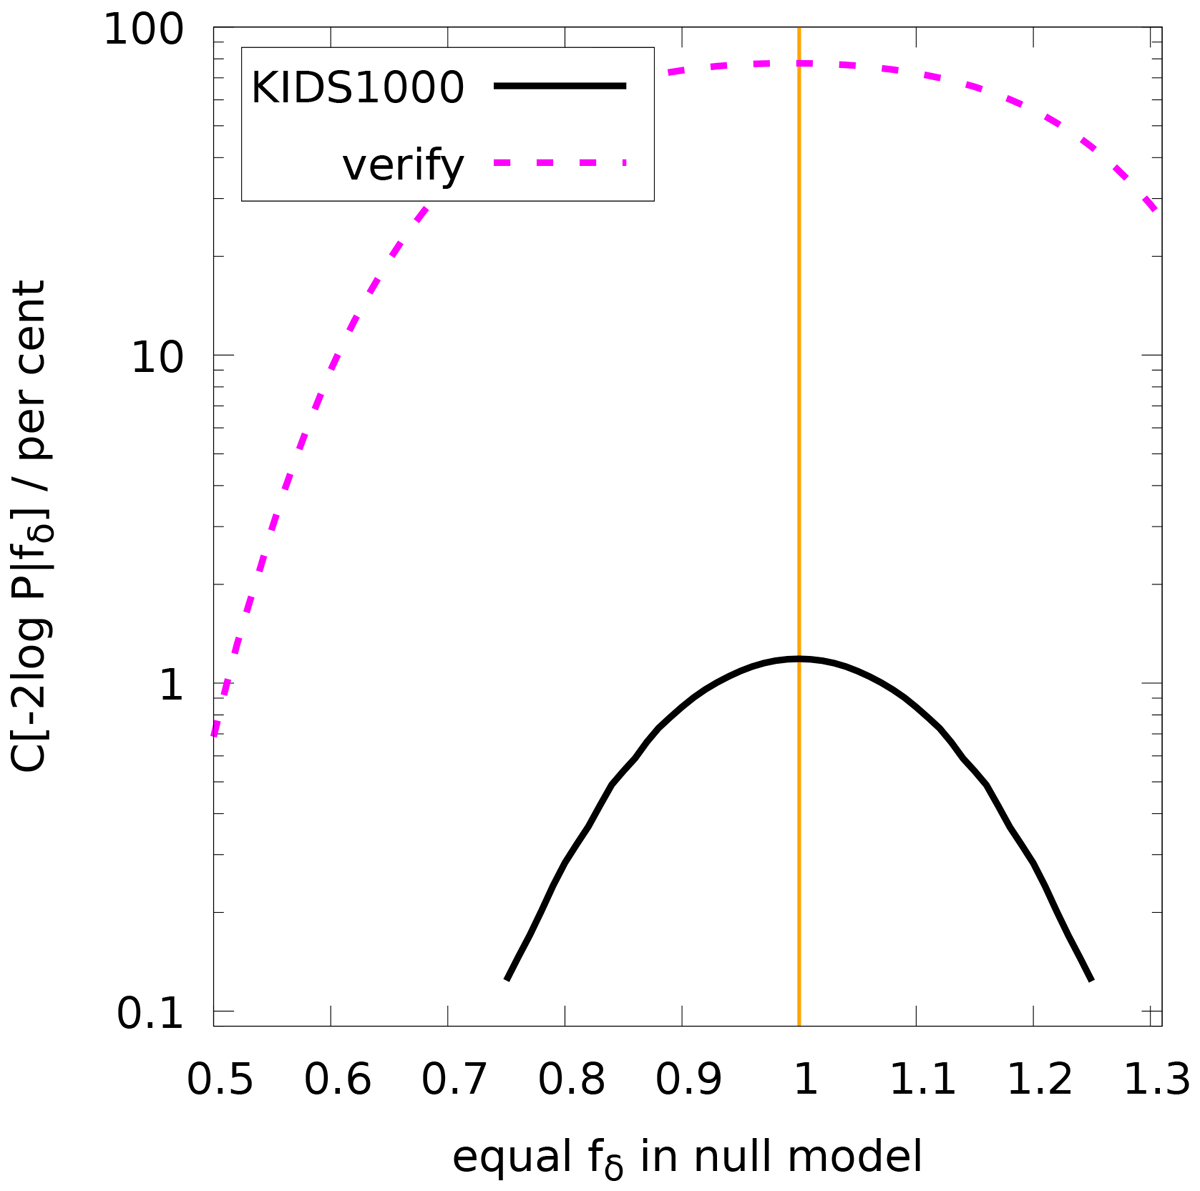
Test of data against a null model with identical ![]() for all m and n (Nz = 3). Shown on the y-axis is the probability of
for all m and n (Nz = 3). Shown on the y-axis is the probability of ![]() being greater than in the null model. The dotted line is the result for one noisy verification data vector that has
being greater than in the null model. The dotted line is the result for one noisy verification data vector that has ![]() ; the solid line is for the KiDS-1000 data. The set-up in Table 1 and the source distributions in Fig. 1 without errors in the projection parameters are assumed.
; the solid line is for the KiDS-1000 data. The set-up in Table 1 and the source distributions in Fig. 1 without errors in the projection parameters are assumed.
Current usage metrics show cumulative count of Article Views (full-text article views including HTML views, PDF and ePub downloads, according to the available data) and Abstracts Views on Vision4Press platform.
Data correspond to usage on the plateform after 2015. The current usage metrics is available 48-96 hours after online publication and is updated daily on week days.
Initial download of the metrics may take a while.