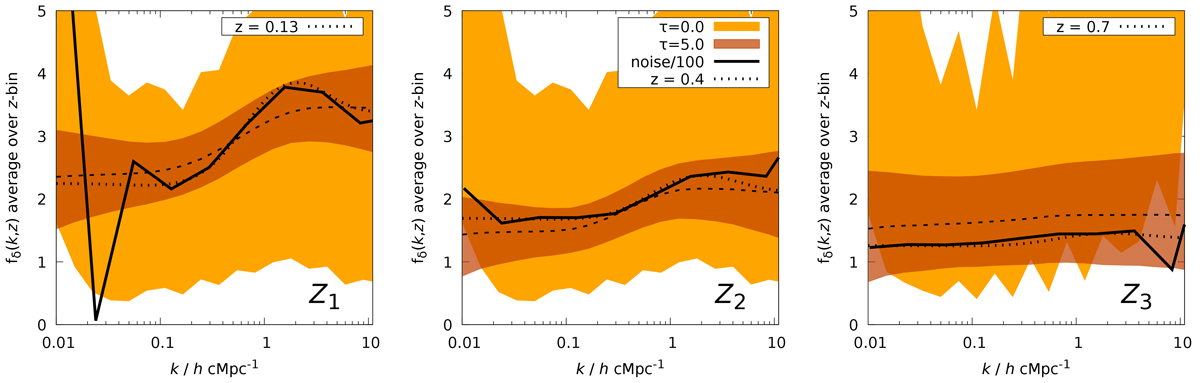
Fig. 2.
Download original image
Impact of the Tikhonov regularisation used to suppress oscillating solutions fδ(k, z). Shown are, for a noise-free mock data vector and the KiDS-1000 error covariance, the posterior constraints (68% credible regions) on fδ averaged over the redshift bin Z1 = [0, 0.3] (left), Z2 = [0.3, 0.6] (middle), and Z3 = [0.6, 2] (right) with and without regularisation (dark orange τ = 5.0 with median as dashed line or light orange τ = 0). To boost scale-dependence and evolution, fδ(k, z) is here defined relative to the power spectrum at fixed redshift, probing the relative structure growth since z = 1. The solid line is the median posterior fδ for 100× reduced measurement errors, providing a nearly noise-free reference (noise/100) that averages the growth over the redshift bin while still exhibiting artefacts near the edges. The dotted lines are the theoretical ![]() for one specific
for one specific ![]() chosen to most closely match the solid lines, indicating the redshift with highest weight in the average.
chosen to most closely match the solid lines, indicating the redshift with highest weight in the average.
Current usage metrics show cumulative count of Article Views (full-text article views including HTML views, PDF and ePub downloads, according to the available data) and Abstracts Views on Vision4Press platform.
Data correspond to usage on the plateform after 2015. The current usage metrics is available 48-96 hours after online publication and is updated daily on week days.
Initial download of the metrics may take a while.