Fig. B.1.
Download original image
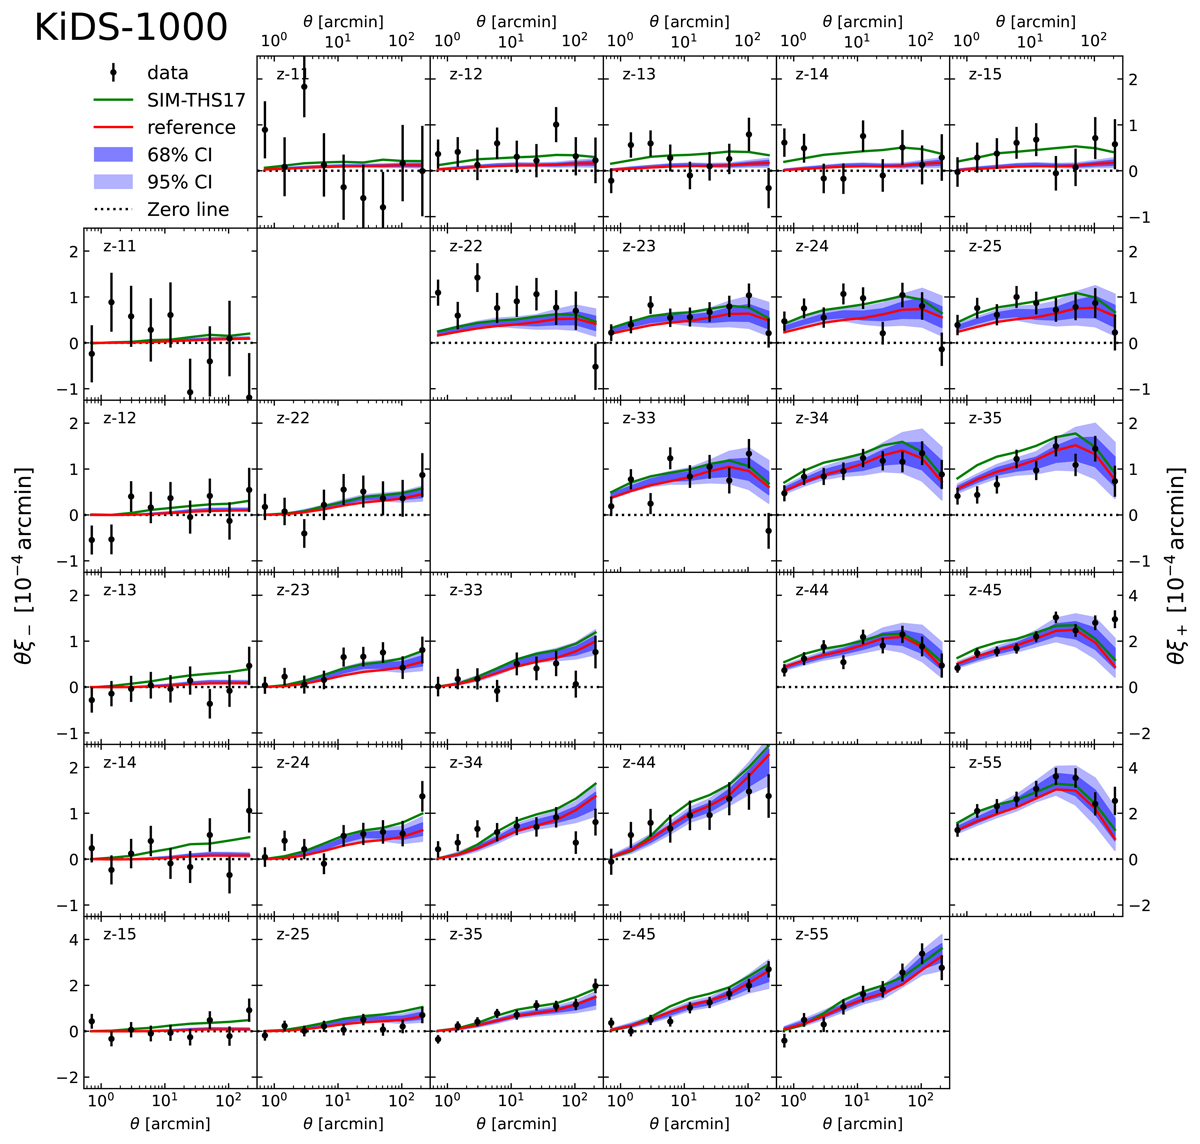
Posterior predictive of the Bayesian analysis using KiDS-1000 tomographic shear correlations and a relative power, fδ(k, z), averaged inside the three redshift bins Z1 = [0, 0.3], Z2 = [0.3, 0.6], and Z3 = [0.6, 2]. For each tomographic bin combination (ij), the panels with labels ‘z–ij’ show the posterior model constraints as light blue (95% CI) regions and dark blue (68% CI) regions about the median for either θ ξ−(ij)(θ) (lower left triangle) or θ ξ+(ij)(θ) (upper right triangle), both in units of ![]() and as function of lag θ. Black points with error bars (1σ) are the KiDS-1000 data points. The red lines correspond to the ΛCDM reference power spectrum with S8 ≈ 0.73, the solid green lines ‘SIM-THS17’ correspond to the prediction by Takahashi et al. (2017), see Sect. 5.5, for S8 ≈ 0.79. Errors of ξ±(ij)(θ) are correlated between θ-bins and tomographic bins, marginal errors due to lensing kernel and IA uncertainties are not included here (adding another ∼10% to CIs). Conflicts with the data are visible for θ ξ+(ij) in z–22 and to a lesser degree for z–12 to z–15. Figure A.4 shows a random realisation of the reference model.
and as function of lag θ. Black points with error bars (1σ) are the KiDS-1000 data points. The red lines correspond to the ΛCDM reference power spectrum with S8 ≈ 0.73, the solid green lines ‘SIM-THS17’ correspond to the prediction by Takahashi et al. (2017), see Sect. 5.5, for S8 ≈ 0.79. Errors of ξ±(ij)(θ) are correlated between θ-bins and tomographic bins, marginal errors due to lensing kernel and IA uncertainties are not included here (adding another ∼10% to CIs). Conflicts with the data are visible for θ ξ+(ij) in z–22 and to a lesser degree for z–12 to z–15. Figure A.4 shows a random realisation of the reference model.
Current usage metrics show cumulative count of Article Views (full-text article views including HTML views, PDF and ePub downloads, according to the available data) and Abstracts Views on Vision4Press platform.
Data correspond to usage on the plateform after 2015. The current usage metrics is available 48-96 hours after online publication and is updated daily on week days.
Initial download of the metrics may take a while.