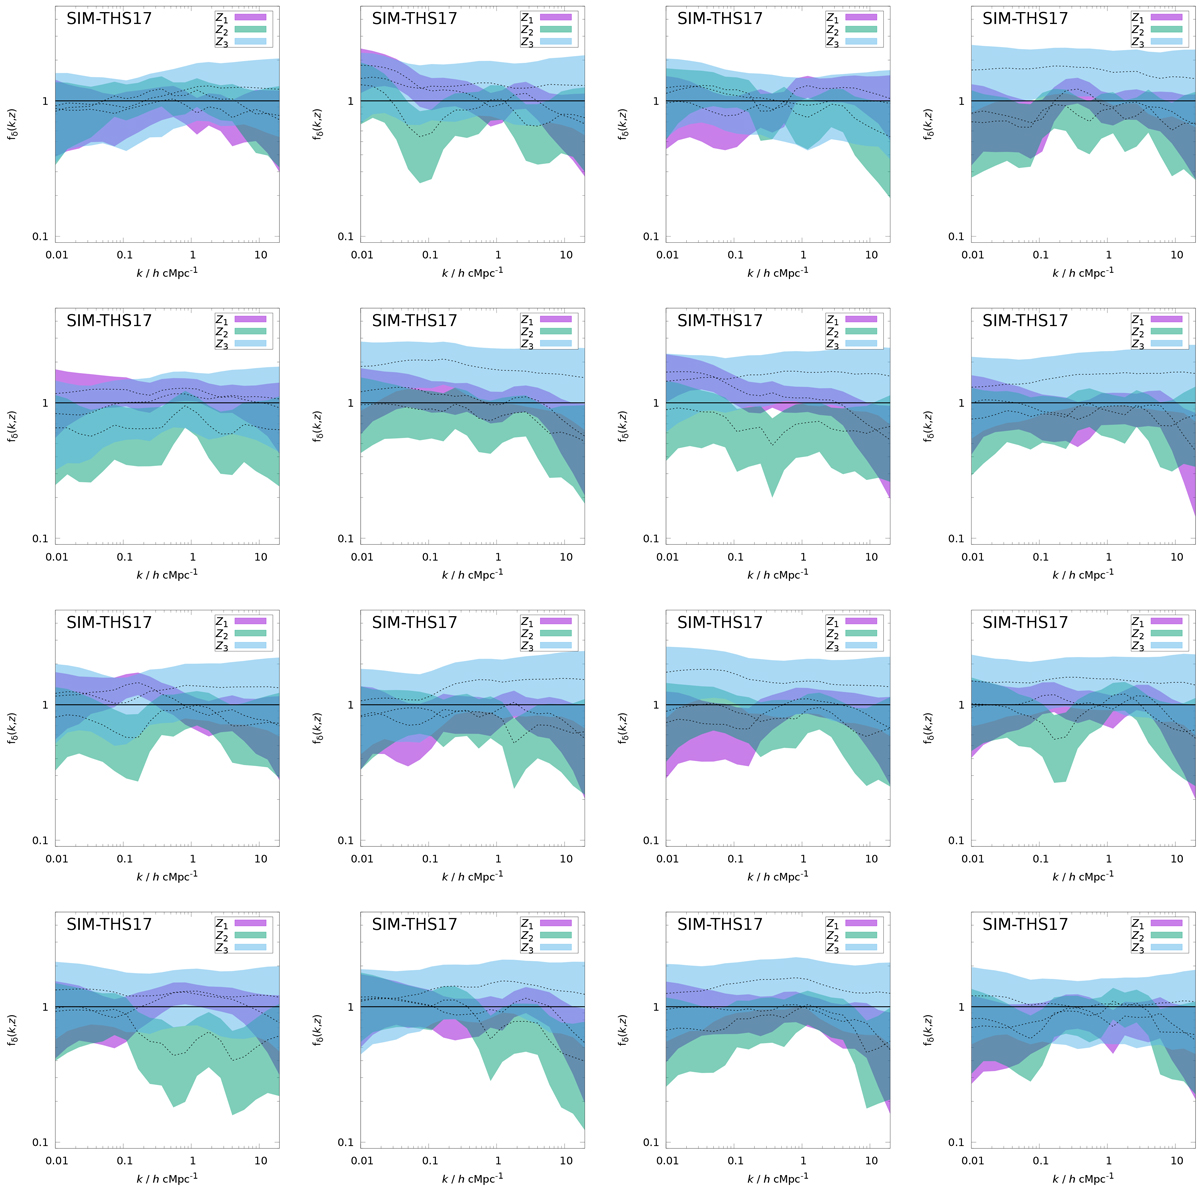
Fig. A.5.
Download original image
Illustration of possible variations in fδ(k, z) reconstructions (68% CIs about the median) using τ = 5.0 and Nk = 20 on noisy data vectors from the ray-traced KiDS-1000 mock-data which has fδ ≈ 1 (Sect. 5.5). There is a tendency for fδ > 1 in Z3 = [0.6, 2] (cyan), and a tendency for fδ < 1 in Z2 = [0.3, 0.6] (green) due to skewed PDFs and correlated errors. The magenta region shows the constraints for Z1 = [0, 0.3] which are the tightest compared to Z2 and Z3. An average over many reconstructions is shown in the bottom panel of Fig. 6.
Current usage metrics show cumulative count of Article Views (full-text article views including HTML views, PDF and ePub downloads, according to the available data) and Abstracts Views on Vision4Press platform.
Data correspond to usage on the plateform after 2015. The current usage metrics is available 48-96 hours after online publication and is updated daily on week days.
Initial download of the metrics may take a while.