Open Access
Fig. A.3.
Download original image
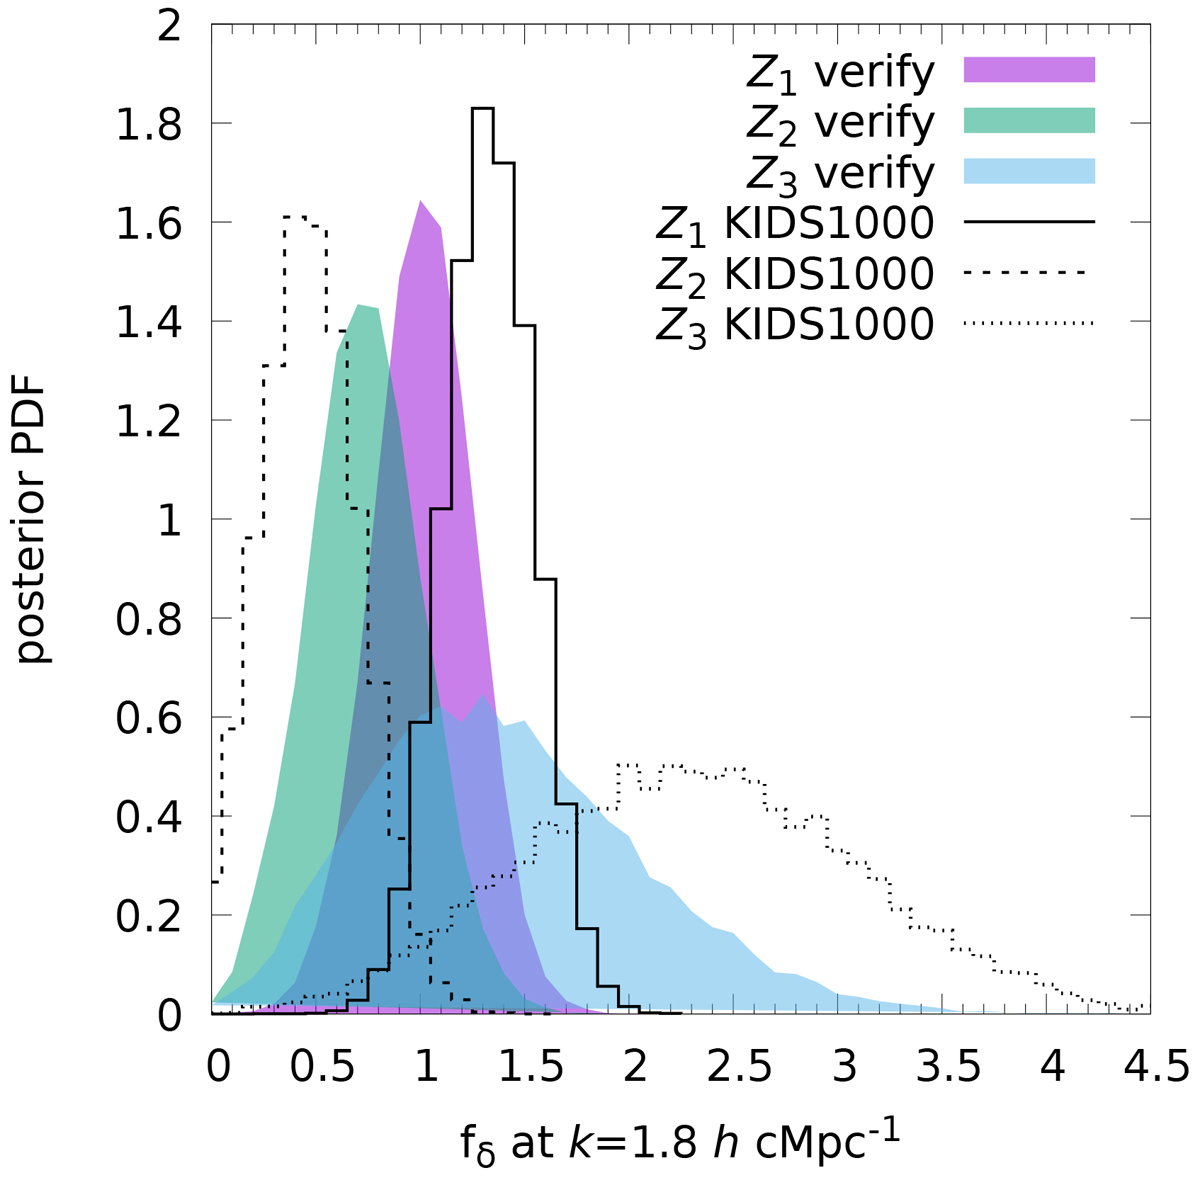
Posterior PDF of fδ, mn at ![]() in three separate redshift bins Z1 = [0, 0.3], Z2 = [0.3, 0.5], and Z3 = [0.6, 2]. The filled regions are PDFs for a noisy verification run with fδ(k, z)≡1, as in Fig. A.2, and the lines use the KiDS-1000 tomographic data (without marginalisation of projection parameters).
in three separate redshift bins Z1 = [0, 0.3], Z2 = [0.3, 0.5], and Z3 = [0.6, 2]. The filled regions are PDFs for a noisy verification run with fδ(k, z)≡1, as in Fig. A.2, and the lines use the KiDS-1000 tomographic data (without marginalisation of projection parameters).
Current usage metrics show cumulative count of Article Views (full-text article views including HTML views, PDF and ePub downloads, according to the available data) and Abstracts Views on Vision4Press platform.
Data correspond to usage on the plateform after 2015. The current usage metrics is available 48-96 hours after online publication and is updated daily on week days.
Initial download of the metrics may take a while.