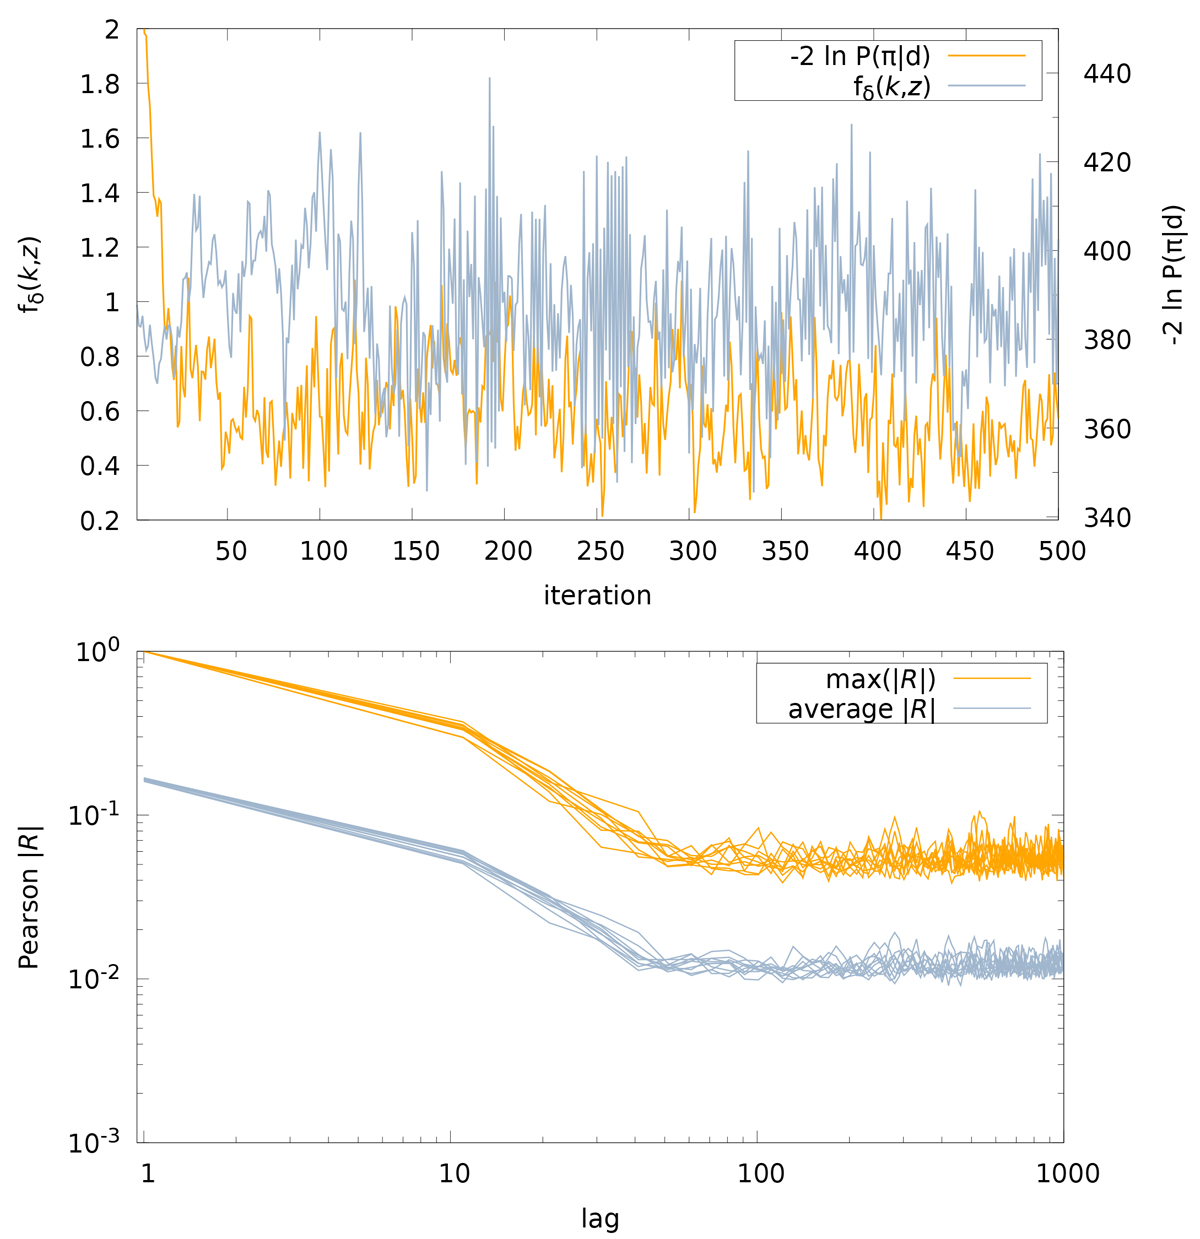
Fig. A.1.
Download original image
Diagnostic plots of the Hamiltonian MCMC sampler with KiDS-1000 data and our final analysis set-up for fixed projection parameters as in Table 1. Top panel: Example of fδ, mn variations along one random chain at the beginning of the burn-in, starting from the random initial point i = 0 (blue line). The orange line depicts the (negative log-) posterior probability −2lnP(πi|d). Bottom panel: Decrease in the correlation of fδ, mn and fδ, kl with δi iterations lag as estimated in ten randomly chosen, independent chains. The orange lines follows, one line per chain, the maximum absolute-value Pearson correlation coefficient |Rmn, kl|, while the blue lines follows the average |Rmn, kl| over all variable combinations (mn, kl). The sampling points quickly decorrelate after a few hundred iterations; the flattening after lag δi ∼ 100 is due to the statistical error in the estimated |R| for chains of finite length nmcmc = 5 × 10⁴.
Current usage metrics show cumulative count of Article Views (full-text article views including HTML views, PDF and ePub downloads, according to the available data) and Abstracts Views on Vision4Press platform.
Data correspond to usage on the plateform after 2015. The current usage metrics is available 48-96 hours after online publication and is updated daily on week days.
Initial download of the metrics may take a while.