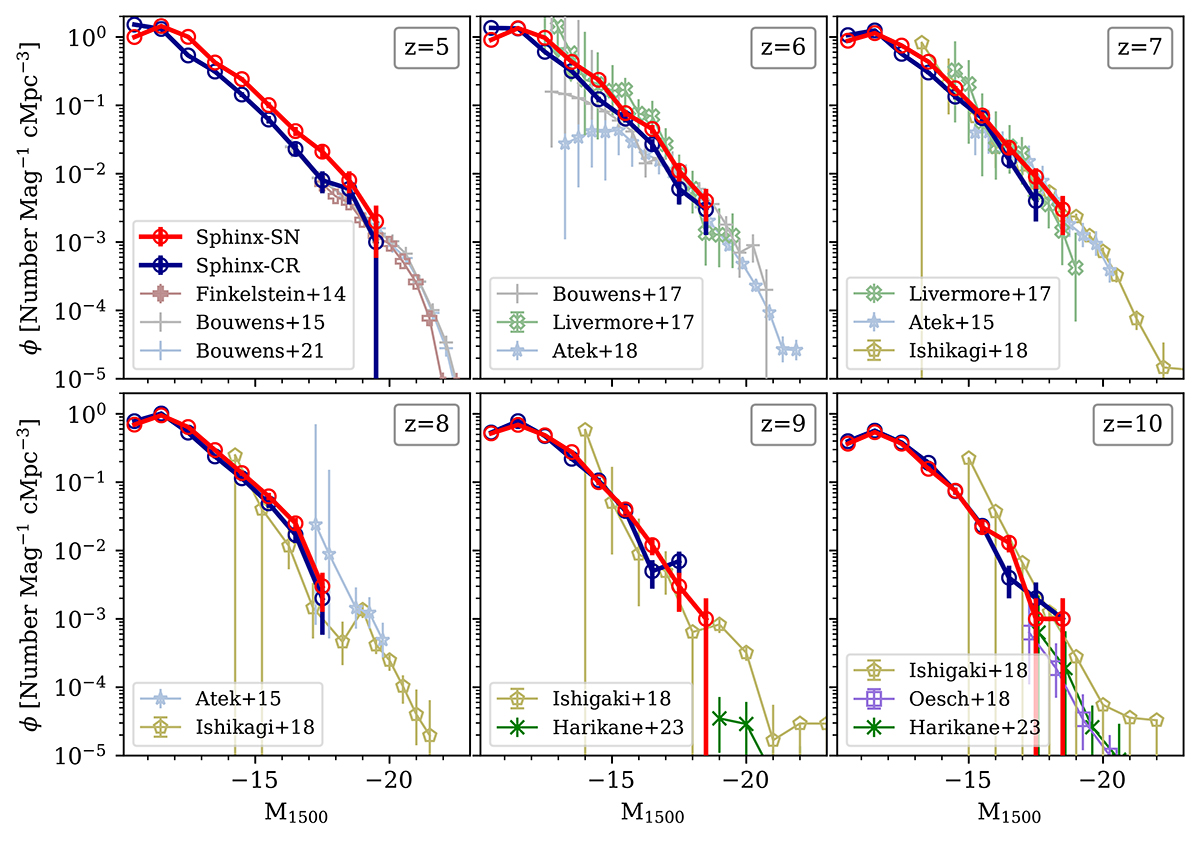
Fig. 5.
Download original image
Dust-attenuated UV luminosity function in SPHINX-SN (red) and SPHINX-CR (dark blue), with Poissonian error-bars. From the top left to the bottom right panel, we show increasing redshift from 5 to 10. The references of the observations shown in each panel are written in the legend. At any time, the UV luminosity functions of the two simulations are very similar and consistent with the observational constraints.
Current usage metrics show cumulative count of Article Views (full-text article views including HTML views, PDF and ePub downloads, according to the available data) and Abstracts Views on Vision4Press platform.
Data correspond to usage on the plateform after 2015. The current usage metrics is available 48-96 hours after online publication and is updated daily on week days.
Initial download of the metrics may take a while.