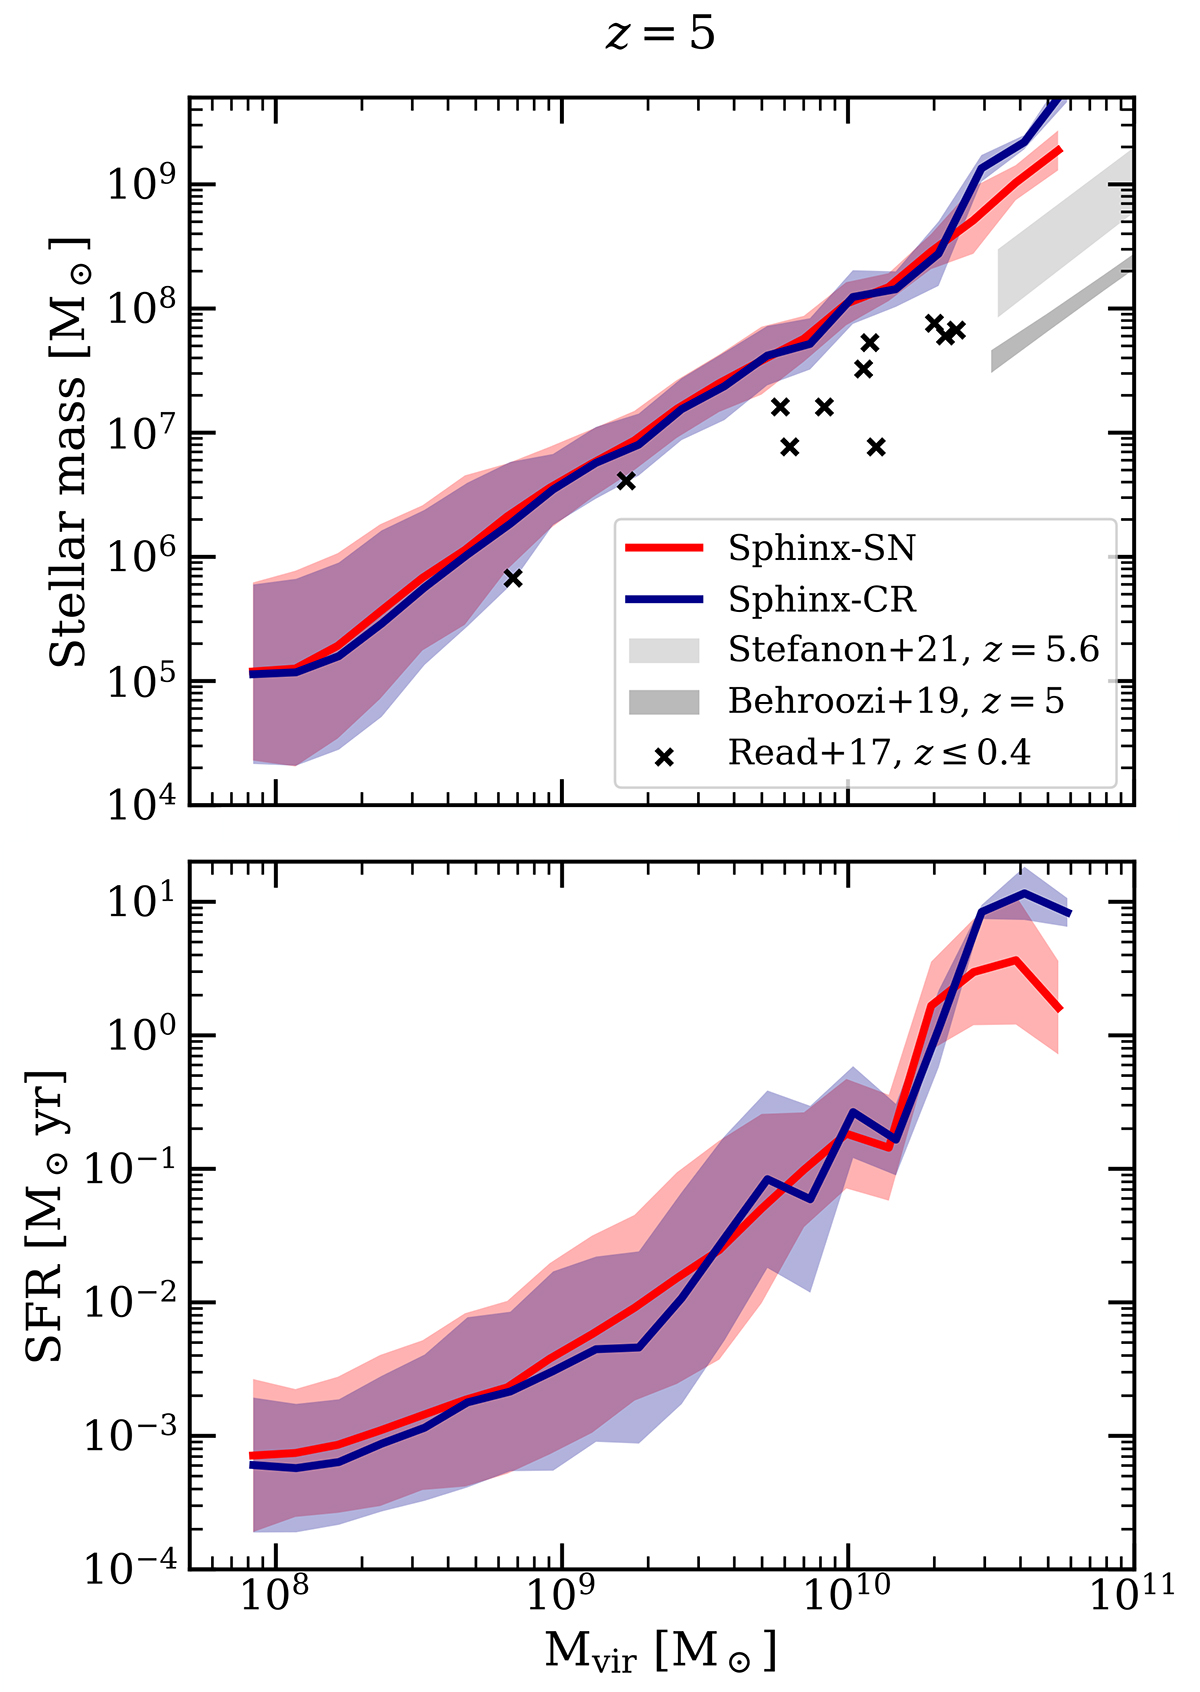
Fig. 4.
Download original image
SMHM relation (upper panel) and 10-Myr averaged SFR (lower panel) versus halo mass in SPHINX-SN (red) and SPHINX-CR (dark blue) at z = 5. The curves respectively show the averaged stellar mass and SFR per bin of halo virial mass, and the coloured shaded regions represent the standard deviation. We also show observational constraints from Read et al. (2017) at 0.2 ≤ z ≤ 0.4 with black crosses, from Behroozi et al. (2019) at z = 5 with a dark grey shaded area and from Stefanon et al. (2021) at z = 5.6 with a light grey shaded region. At any halo mass, the stellar mass is roughly the same in the two simulations, but tends to be higher than the observational constraints. At the massive end, galaxies are more massive in SPHINX-CR and have higher SFRs.
Current usage metrics show cumulative count of Article Views (full-text article views including HTML views, PDF and ePub downloads, according to the available data) and Abstracts Views on Vision4Press platform.
Data correspond to usage on the plateform after 2015. The current usage metrics is available 48-96 hours after online publication and is updated daily on week days.
Initial download of the metrics may take a while.