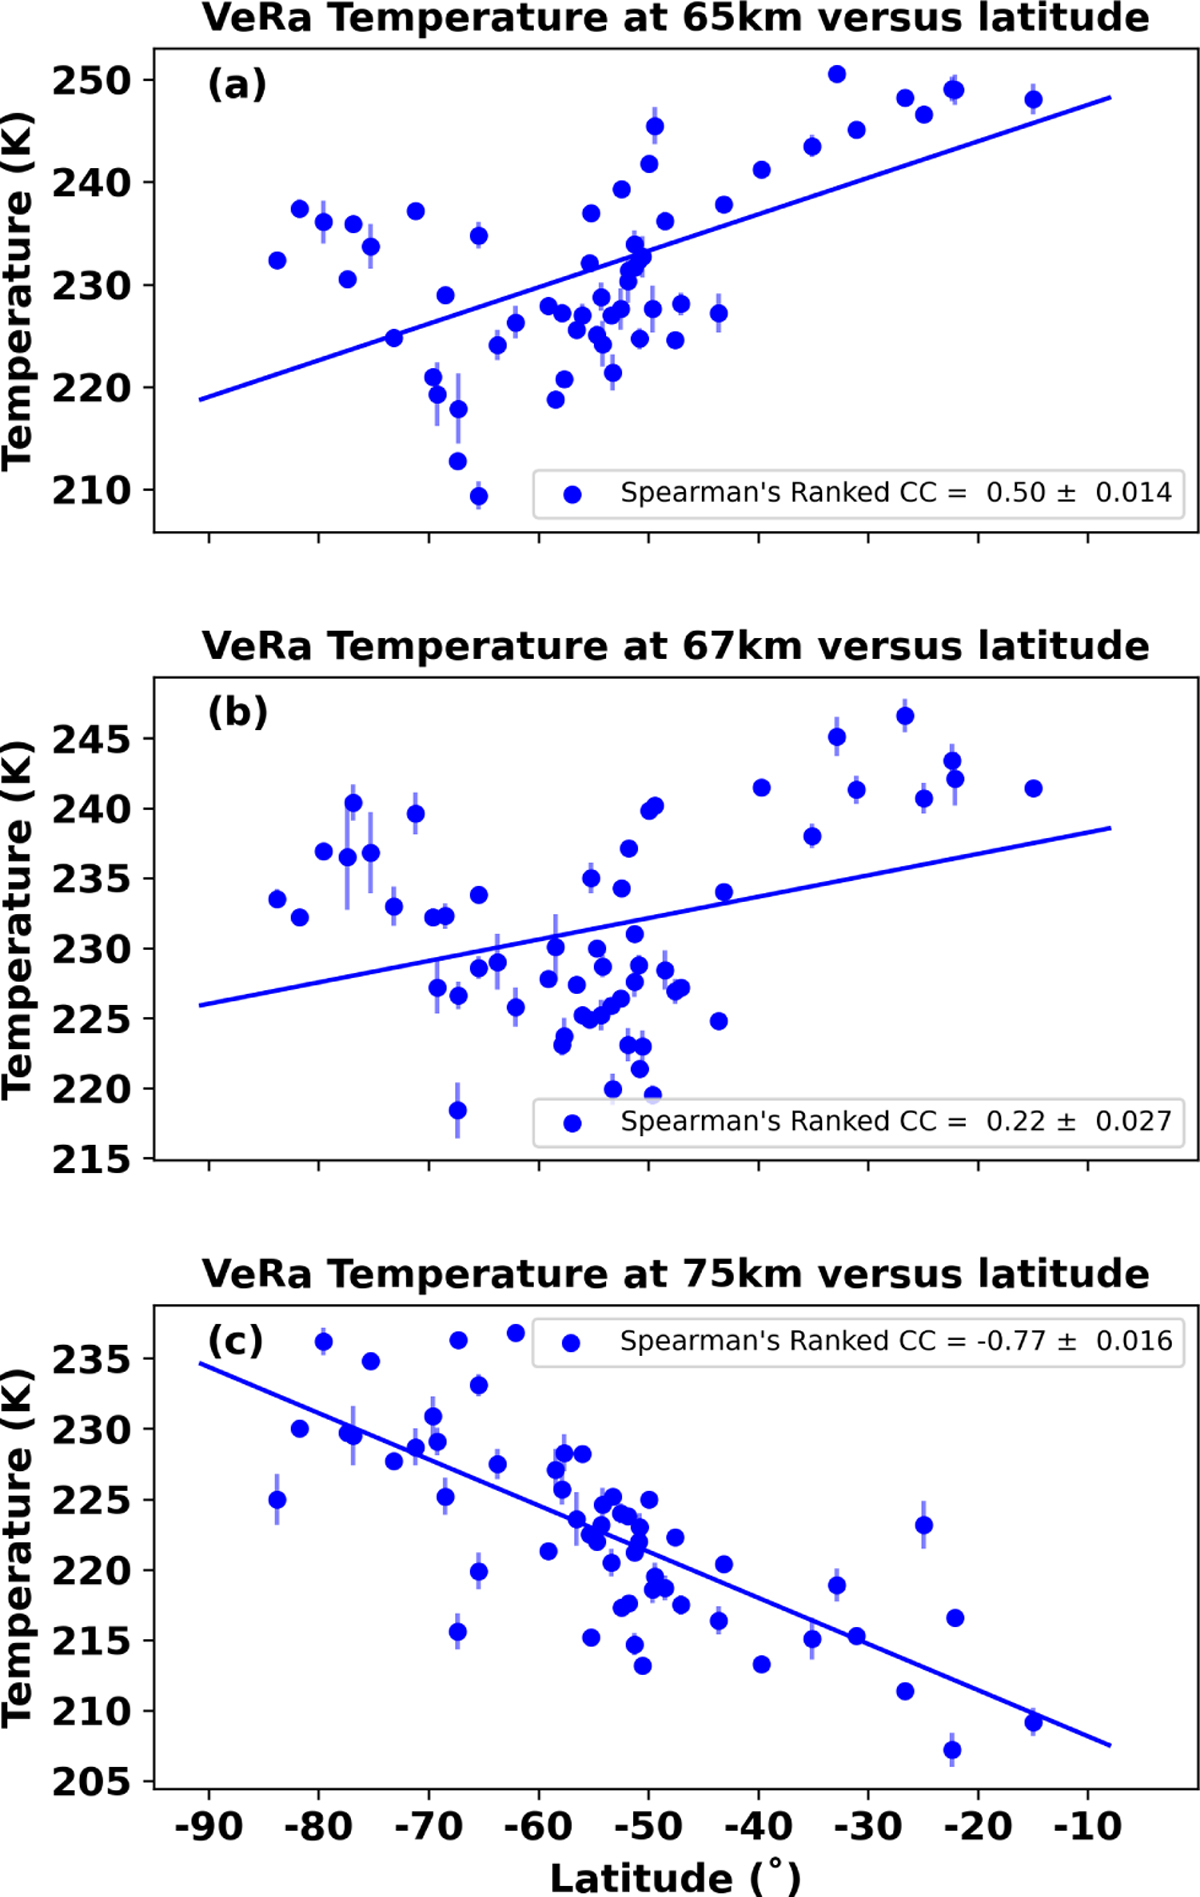
Fig. 8
Download original image
Temperature derived from 56 VeRa soundings (Table A.1) as a function of latitude at 65,67 , and 75 km in altitude. There is a clear correlation at the lower and higher altitudes and no clear correlation in between. This is also clearly seen in Fig. 9, where the Spearman’s rank and Pearson correlation coefficients are shown as a function of altitude. The lines are the least square linear fits.
Current usage metrics show cumulative count of Article Views (full-text article views including HTML views, PDF and ePub downloads, according to the available data) and Abstracts Views on Vision4Press platform.
Data correspond to usage on the plateform after 2015. The current usage metrics is available 48-96 hours after online publication and is updated daily on week days.
Initial download of the metrics may take a while.