Fig. 6
Download original image
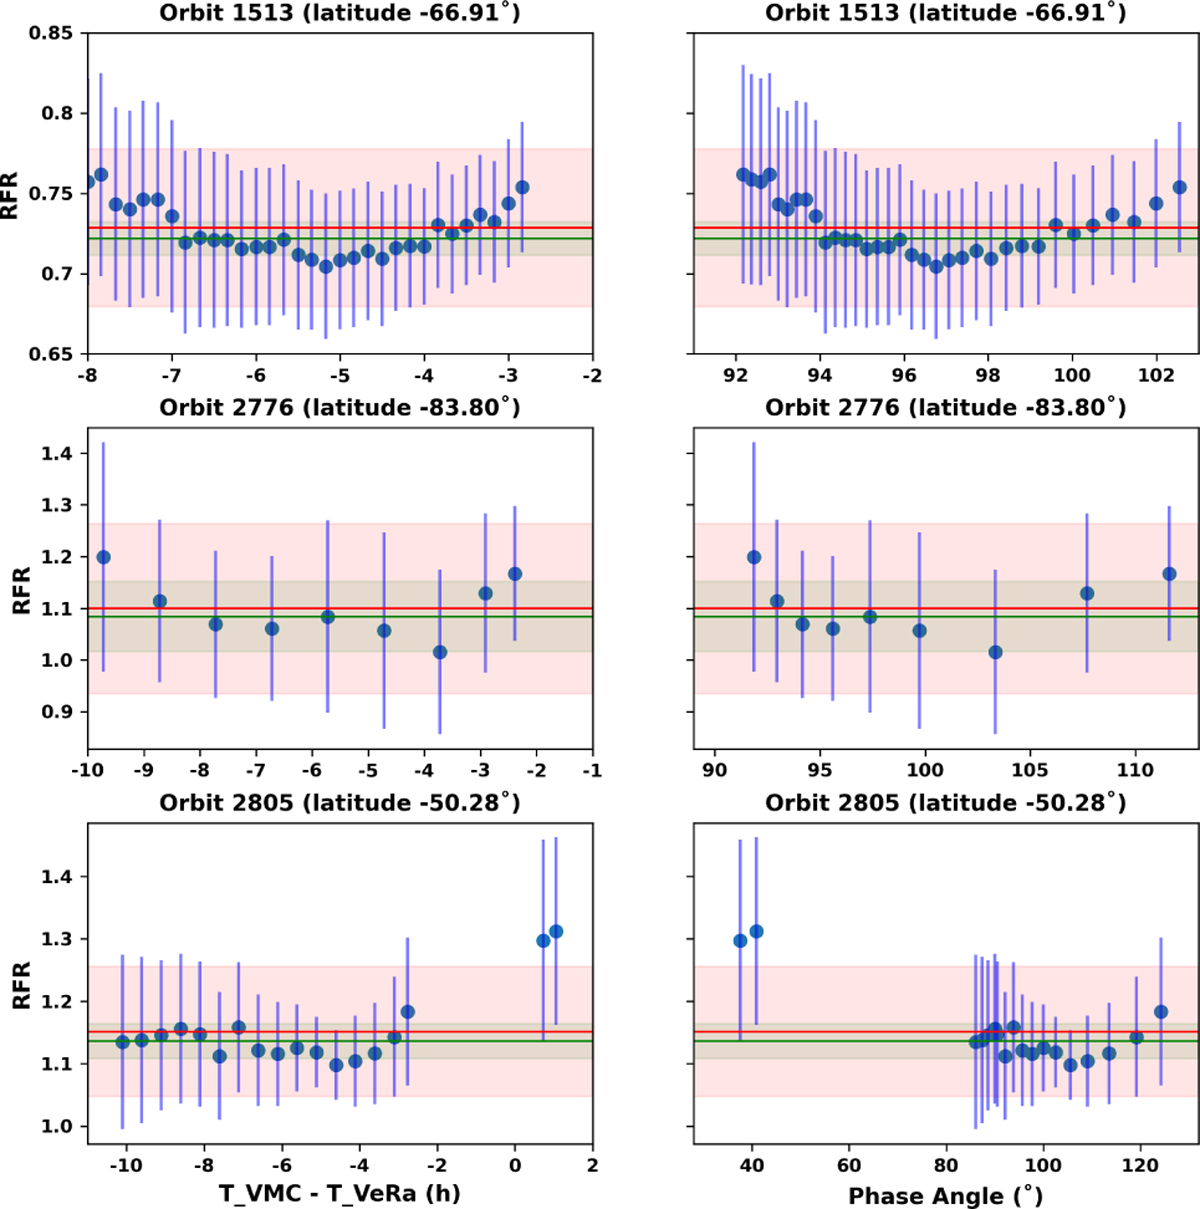
Examples of the RFRs for sequences of images on a same orbit, derived from the radiance factors extracted from the latitude-longitude boxes of the wind-advected areas (Fig. 4) and applying the phase curve model (Fig. 5). We expect these values to be very similar throughout one orbit. The average and standard deviation is shown in red; the median and associated uncertainties in green. See also Table A.1.
Current usage metrics show cumulative count of Article Views (full-text article views including HTML views, PDF and ePub downloads, according to the available data) and Abstracts Views on Vision4Press platform.
Data correspond to usage on the plateform after 2015. The current usage metrics is available 48-96 hours after online publication and is updated daily on week days.
Initial download of the metrics may take a while.