Fig. 4
Download original image
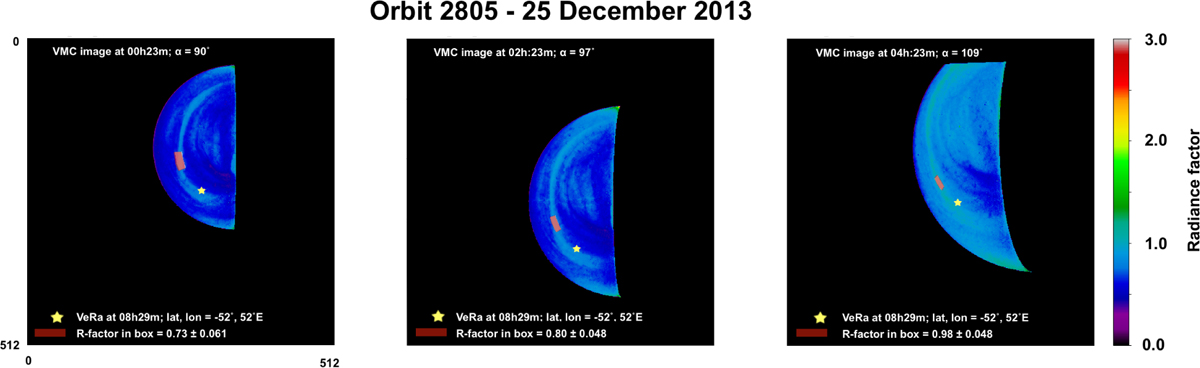
Three images each taken two hours apart during ingress of orbit 2805 on 25 December 2013. The yellow star indicates the spot of the VeRa radio occultation that happens after ![]() , and 4 h , respectively (left to right), from the moment of the image. The red rectangles are the wind-advected latitude-longitude boxes corresponding to VeRa location advected by the zonal and meridional winds. The boundaries of the boxes are measures of the uncertainties in the zonal and meridional winds (see main text for details). It can be seen how the rectangles become smaller when closer in time (and hence in space) to the VeRa sounding location.
, and 4 h , respectively (left to right), from the moment of the image. The red rectangles are the wind-advected latitude-longitude boxes corresponding to VeRa location advected by the zonal and meridional winds. The boundaries of the boxes are measures of the uncertainties in the zonal and meridional winds (see main text for details). It can be seen how the rectangles become smaller when closer in time (and hence in space) to the VeRa sounding location.
Current usage metrics show cumulative count of Article Views (full-text article views including HTML views, PDF and ePub downloads, according to the available data) and Abstracts Views on Vision4Press platform.
Data correspond to usage on the plateform after 2015. The current usage metrics is available 48-96 hours after online publication and is updated daily on week days.
Initial download of the metrics may take a while.