Fig. 10
Download original image
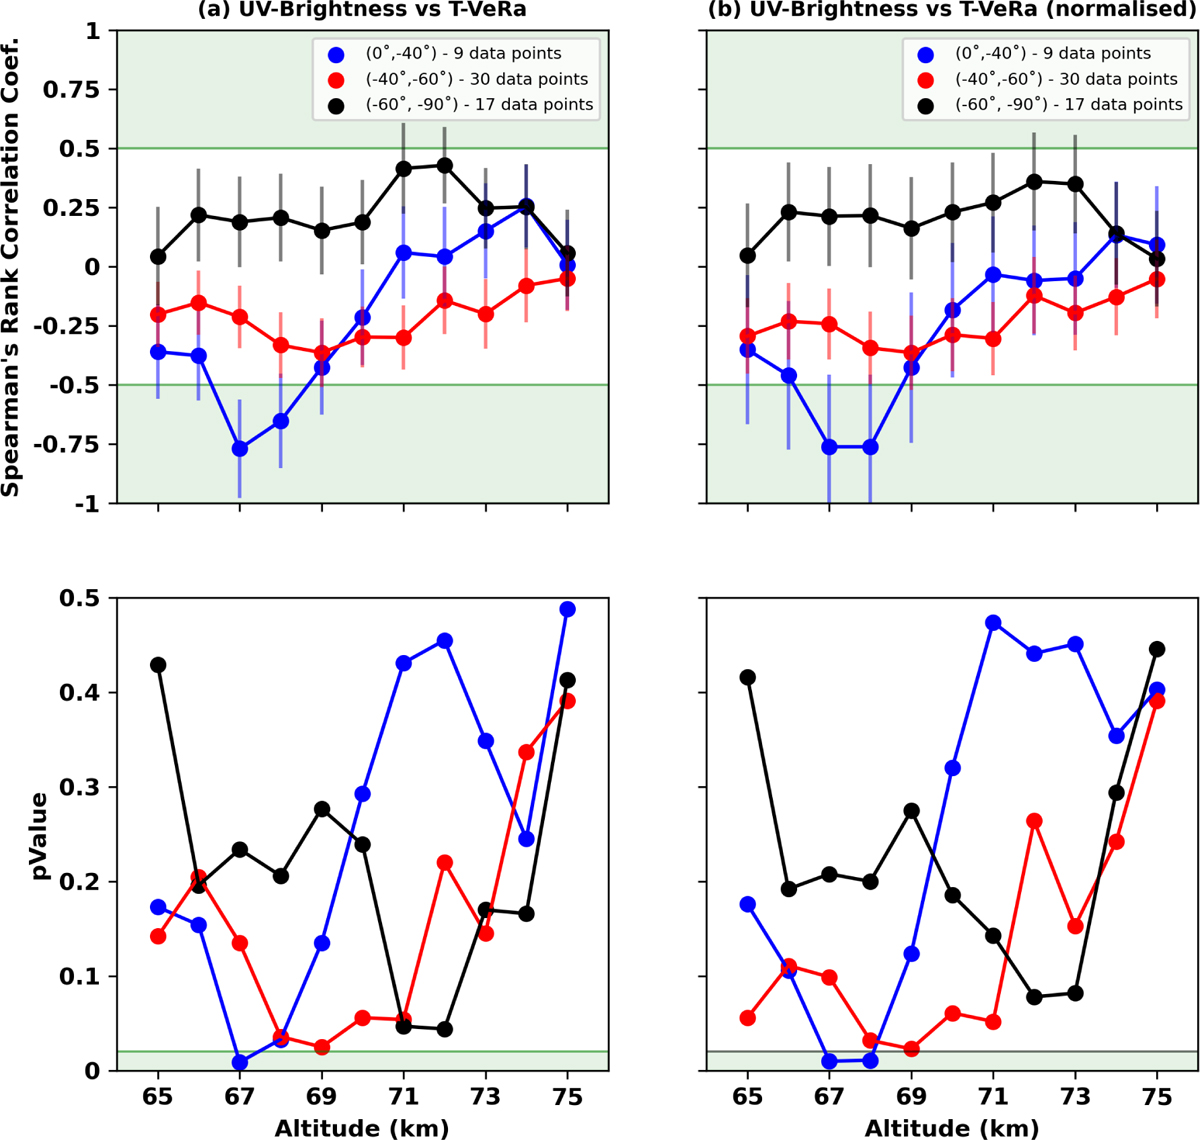
Spearman’s rank correlation coefficients for UV RFR as a function of temperature (left column) and normalised temperature (right column), at levels between 65 and 75 km in altitude for three latitude bins. Normalisation of the temperature was done to compensate for changes in the temperature with latitude that were not fully accounted for by dividing the data into three latitude bins. The largest effect is at the lower and higher altitudes, where the change of temperature with latitude is strongest (Figs. 8,9,11). The green areas in the figure indicate moderate to strong correlation. The corresponding one-sided p value for each of the correlations is shown in the bottom panels. We chose a limit of ![]() to claim significance, which is indicated by the green area at the bottom of the plots. This corresponds to about
to claim significance, which is indicated by the green area at the bottom of the plots. This corresponds to about ![]() . Only for an altitude of 67 km in the uncorrected temperature and 67 and 68 km in altitude in the normalised temperature correlation does the p value drop below the limit.
. Only for an altitude of 67 km in the uncorrected temperature and 67 and 68 km in altitude in the normalised temperature correlation does the p value drop below the limit.
Current usage metrics show cumulative count of Article Views (full-text article views including HTML views, PDF and ePub downloads, according to the available data) and Abstracts Views on Vision4Press platform.
Data correspond to usage on the plateform after 2015. The current usage metrics is available 48-96 hours after online publication and is updated daily on week days.
Initial download of the metrics may take a while.