Fig. 9
Download original image
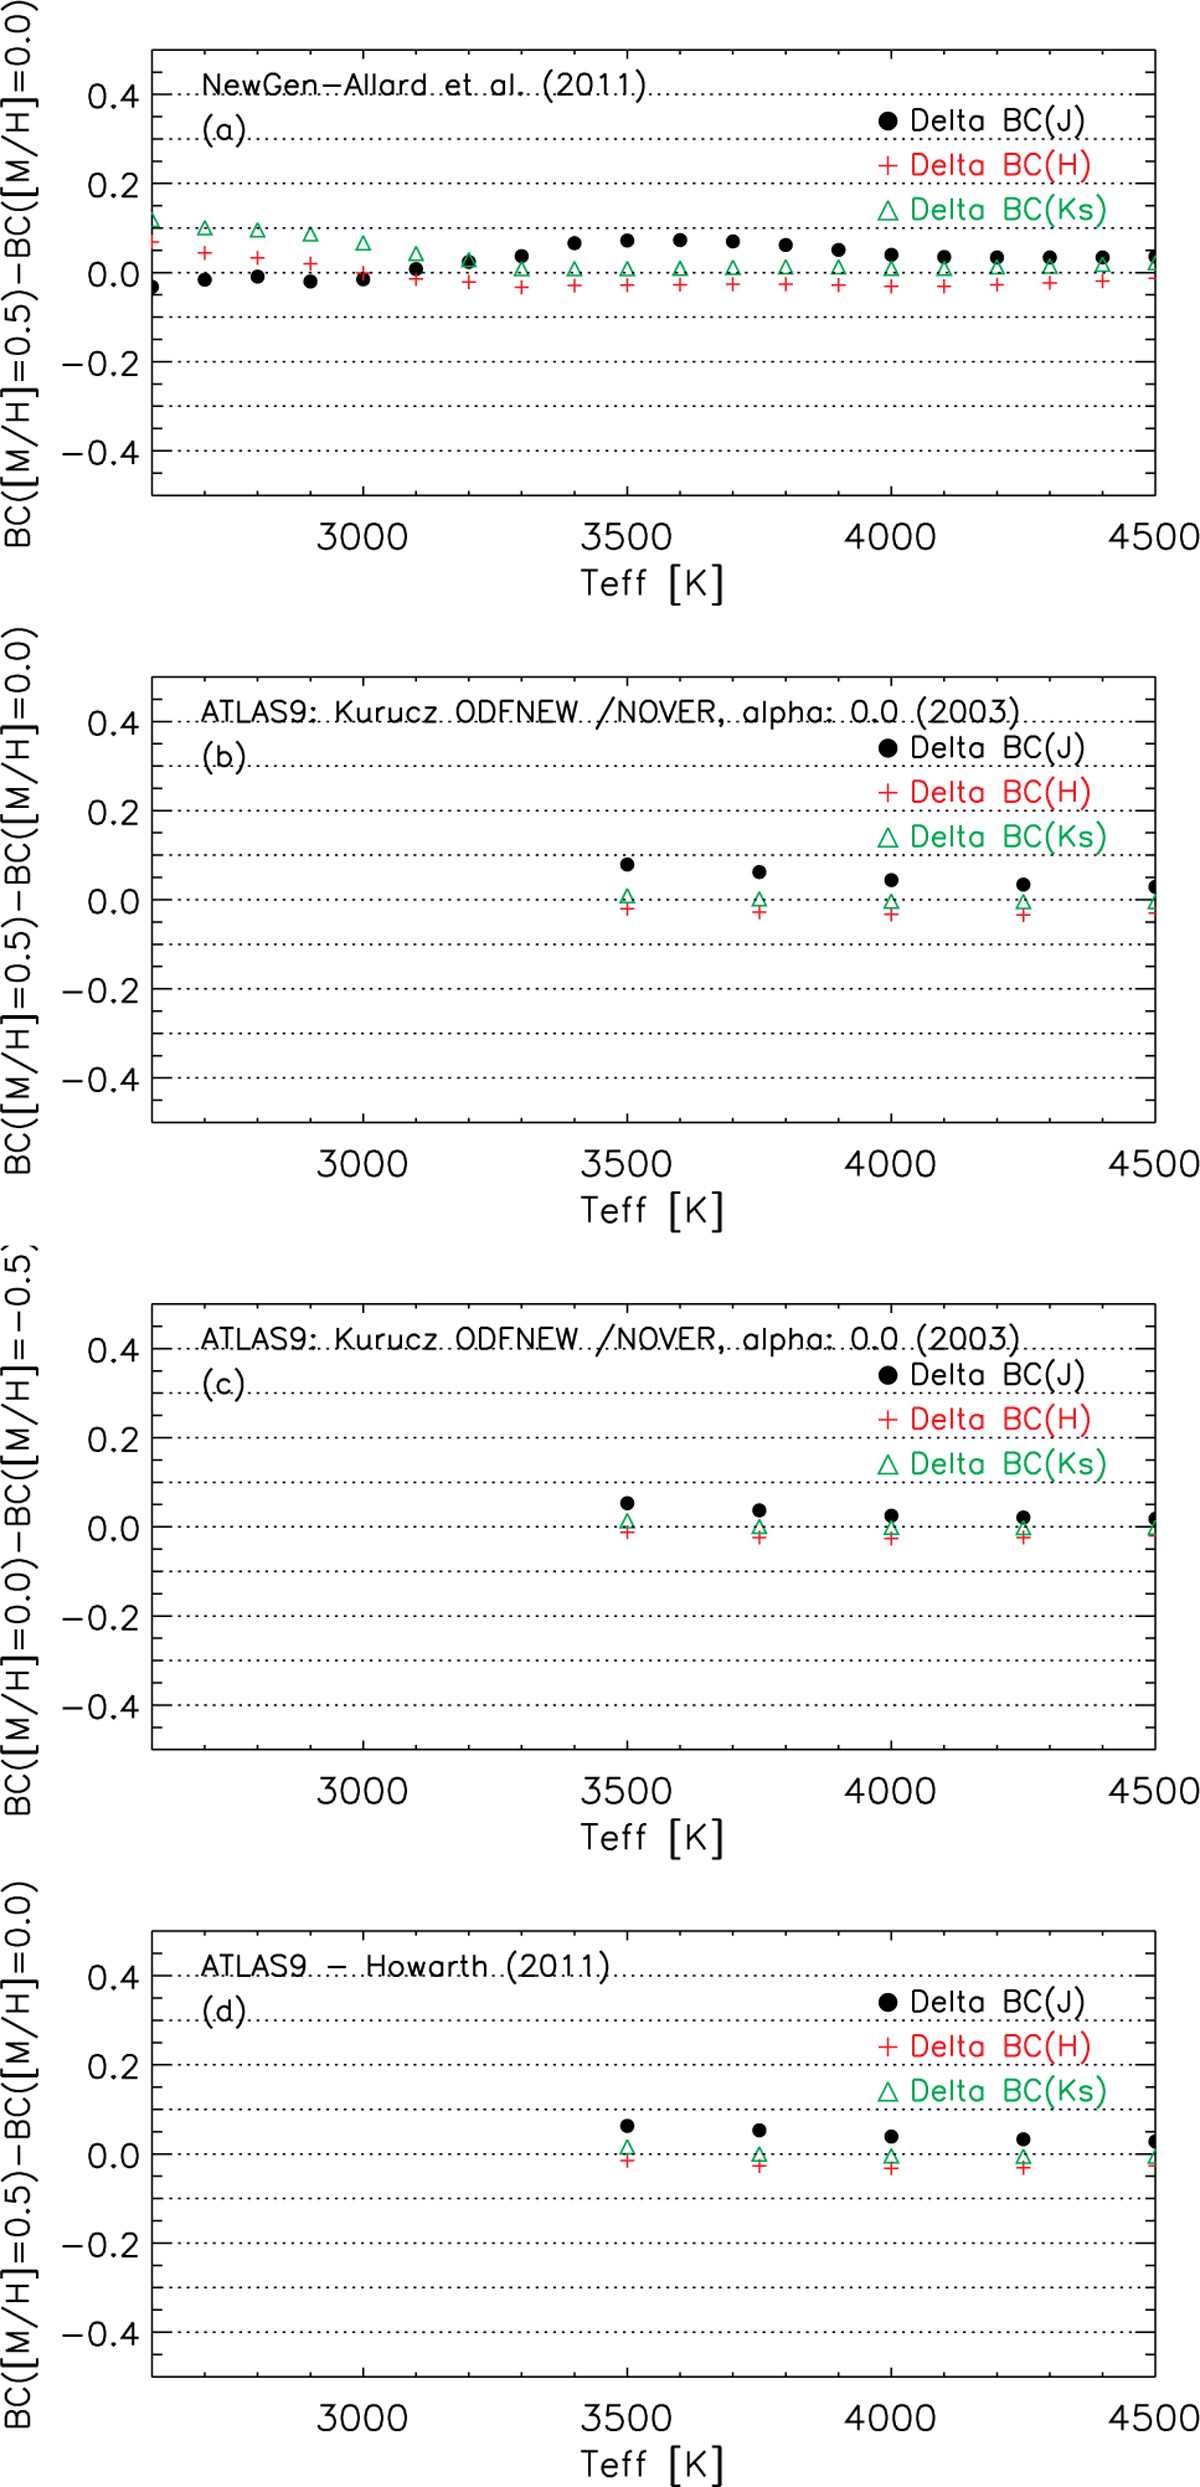
Panel a: differences between BCs in J, H, and Ks bands inferred from the NextGen models of Allard et al. (2011) with log10(g)=0.5, [M/H]=0.5 dex, and Teff ranging from 2600 to 4500 K in steps of 100 K; and the BCs inferred from the same set of models, but with [M/H]=0.0 dex. Panel b: differences between BCs inferred from ATLAS9 models with log10(g)=0.5, [M/H]=0.5 dex, and Teff=3500, 3750, 4000, 4250, and 4500 K; and the BCs inferred from the same set of models, but with [M/H]=0.0 dex. Panel c: differences between BCs inferred from ATLAS9 models with log10(g)=0.5, [M/H]=0.0 dex, and Teff=3500, 3750, 4000, 4250, 4500 K; and the BCs inferred from the same set of models, but with [M/H]=−0.5 dex. Panel d: similar to Panel (b); this time, the ATLAS9 models are those distributed by Howarth (2011). Dotted horizontal lines are drawn every 0.1 mag for easier visualization.
Current usage metrics show cumulative count of Article Views (full-text article views including HTML views, PDF and ePub downloads, according to the available data) and Abstracts Views on Vision4Press platform.
Data correspond to usage on the plateform after 2015. The current usage metrics is available 48-96 hours after online publication and is updated daily on week days.
Initial download of the metrics may take a while.