Fig. 7
Download original image
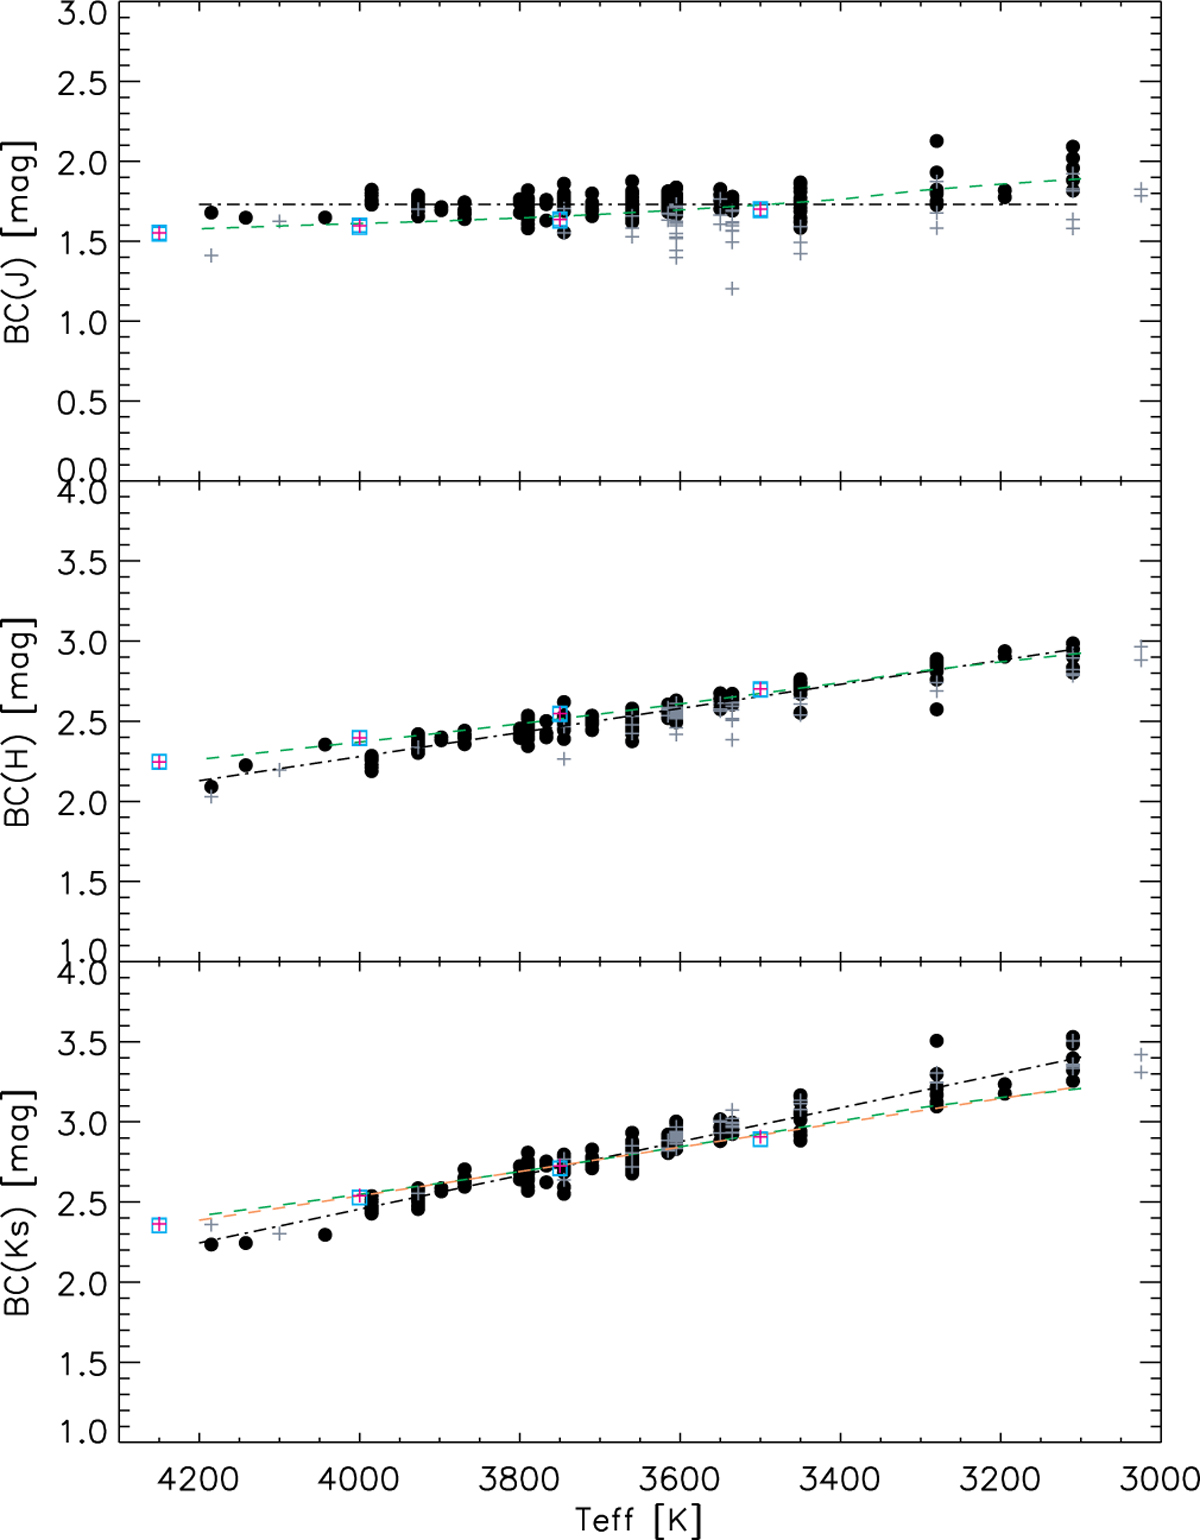
Top panel: for stars with τ2.2 < 0.08, bolometric corrections BCJ are plotted versus Teff values with black-filled circles. For stars with τ2.2 > 0.08, gray crosses are plotted. The BC values were calculated with the Mbol inferred with the atmosphere models by Allard et al. (2011) and the DUSTY code and the absolute J magnitudes (from 2MASS). The dotted-dashed black line is the best polynomial fit of degree zero to the data points. The dashed green line is the theoretical BCJ inferred with Allard’s model ([M/H]=0, log(g)=0.5). The cyan squares mark the BCJ values estimated with an ATLAS9 grid of models and for Bessel filters by Howarth (2011) ([M/H]=0.0 and log(g)=0.5 dex); while our recalculations for the 2MASS filters are marked with red crosses. Middle panel: bolometric corrections BCH versus Teff values. Lines and symbols are as for the top panel. Bottom panel: bolometric corrections BCKs are plotted versus the Teff values. Lines and symbols are as for the top panel. The dashed-orange line is the K-band relation for naked RSGs found with MARCS models and the K-filter profile of Bessell & Brett (1988) by Levesque et al. (2005).
Current usage metrics show cumulative count of Article Views (full-text article views including HTML views, PDF and ePub downloads, according to the available data) and Abstracts Views on Vision4Press platform.
Data correspond to usage on the plateform after 2015. The current usage metrics is available 48-96 hours after online publication and is updated daily on week days.
Initial download of the metrics may take a while.