Fig. 2
Download original image
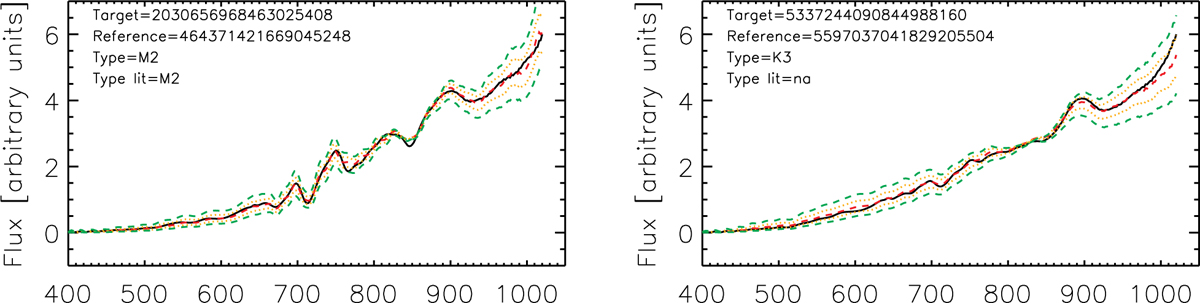
Two examples of BPRP spectra. The target spectrum is shown with a black curve, and the reference spectrum with the dashed red curve. The reference spectrum was brought to the target’s extinction, which is estimated in the infrared. Extinction variations of ΔAKs = ± 0.05 mag and ± 0.10 are indicated with orange dotted and green dashed curves, respectively. Gaia source_ids are given in the figure labels.
Current usage metrics show cumulative count of Article Views (full-text article views including HTML views, PDF and ePub downloads, according to the available data) and Abstracts Views on Vision4Press platform.
Data correspond to usage on the plateform after 2015. The current usage metrics is available 48-96 hours after online publication and is updated daily on week days.
Initial download of the metrics may take a while.