Fig. 11
Download original image
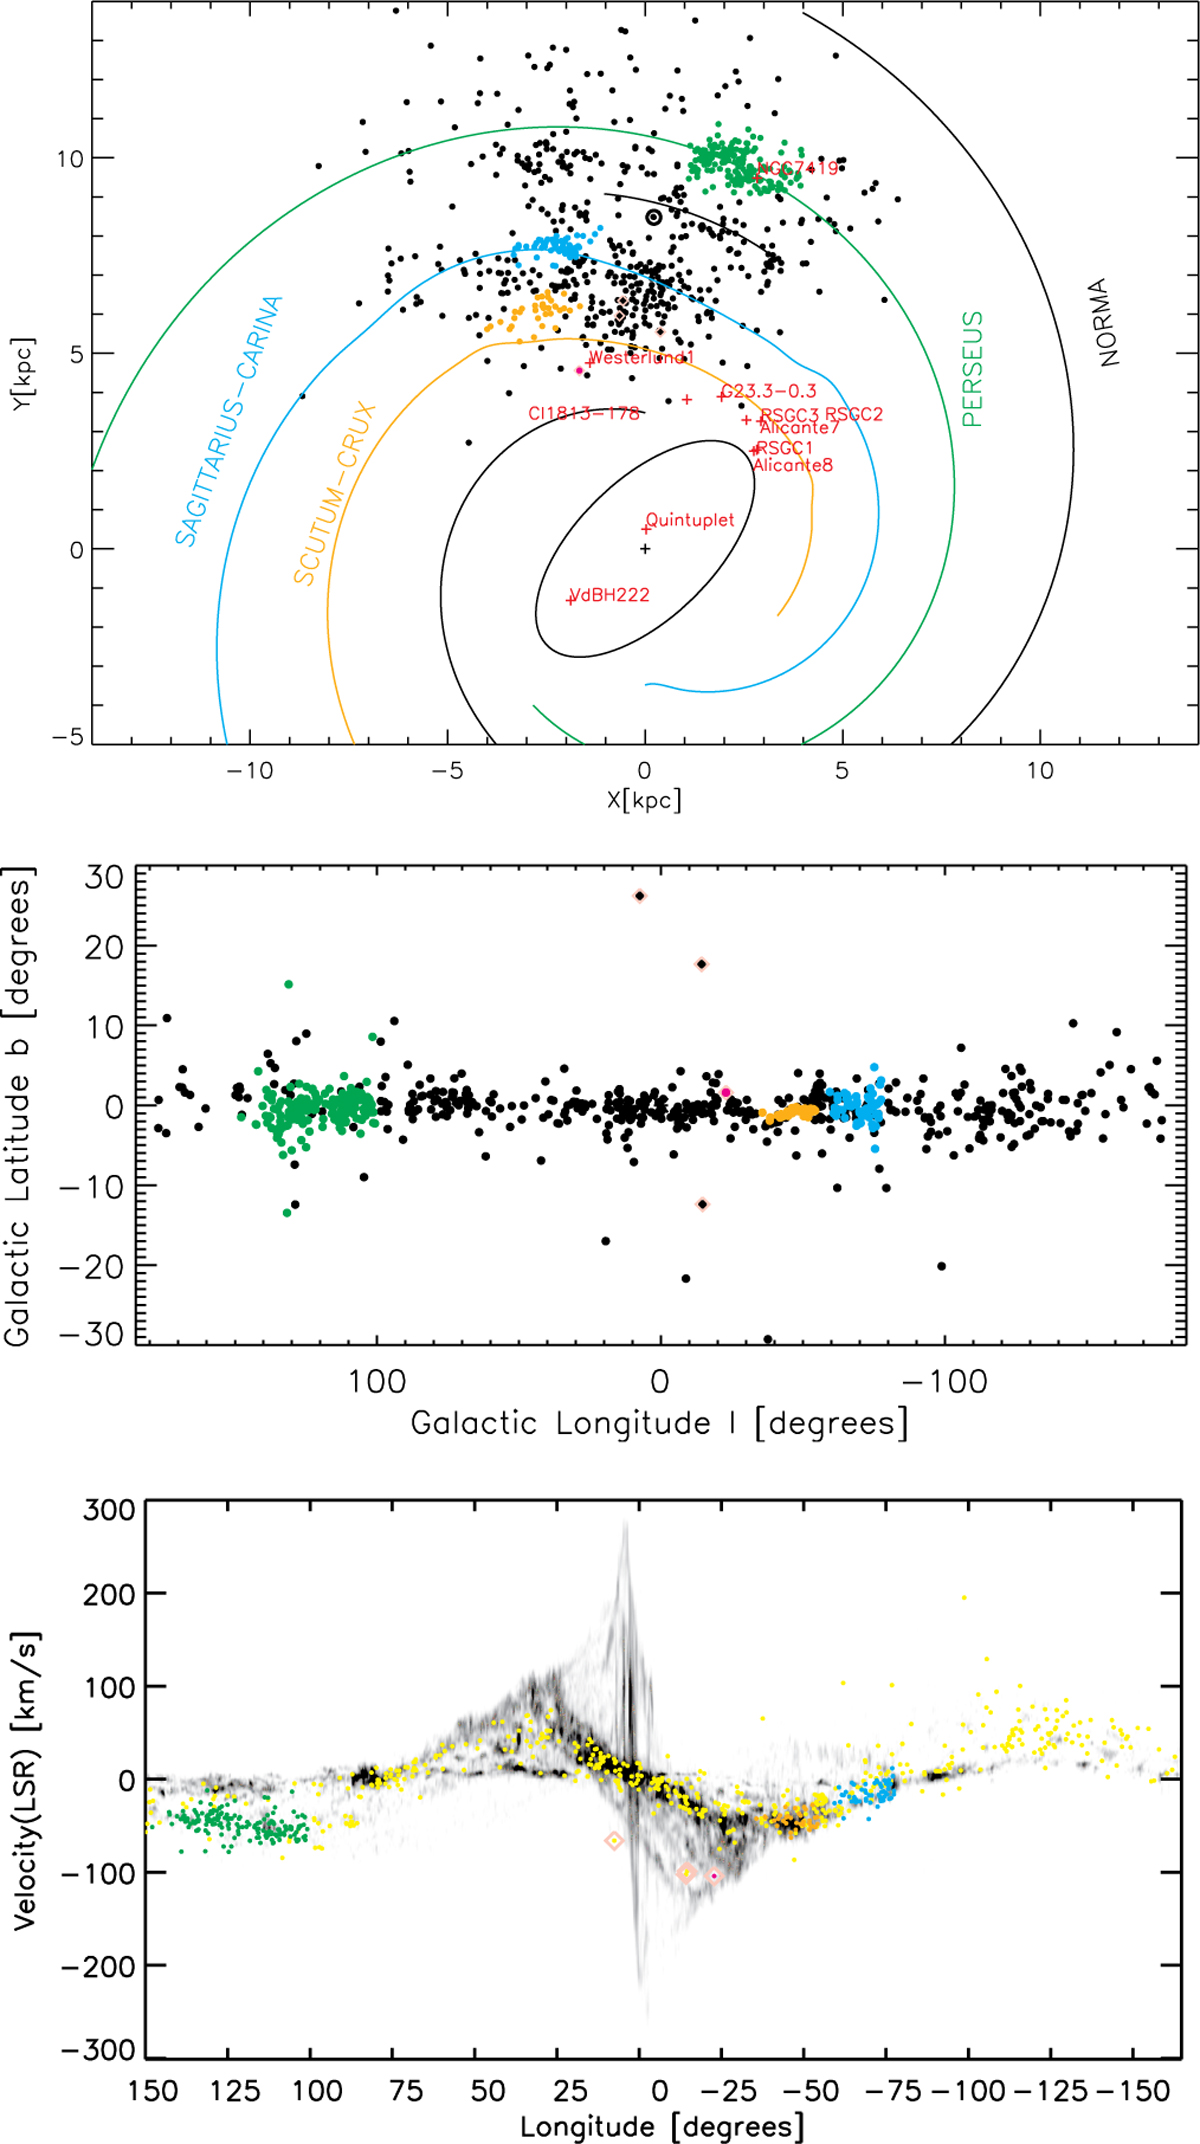
Upper panel: XY view of cRSGs from areas A and B of Messineo & Brown (2019), along with new Gaia-2MASS cRSGs. A distance of 8.5 kpc is adopted, as in the work of Ocker & Cordes (2024). Green filled circles indicate stars located on the large over-density of RSGs of the Perseus arm. Cyan filled circles mark stars corresponding to an apparent concentration of RSGs at the tangent point of the Sagittarius-Carina arm at 1 ≈−78∘ (Hou & Han 2014). Orange-filled circles indicate stars located at the tangent point of the Scutum-Centaurus arm (at 1 ≈−50∘, Hou & Han 2014). Known massive clusters (>104 M⊙) rich in RSGs are marked in red. The spiral arms of Cordes & Lazio (2002), taken from the native NE2001p Python code of Ocker & Cordes (2024), are also shown. Middle panel: longitudes versus latitudes of cRSGs. The green, cyan, and orange data points are as specified in the upper panel. Lower panel: vLSR velocities versus longitudes of cRSGs (shown in yellow). The green, cyan, and orange data points are as specified in the upper panel. The background grayscale image is the CO map by Dame et al. (2001). Four points with peculiar velocities are indicated with pink diamonds; three of them are at high latitudes.
Current usage metrics show cumulative count of Article Views (full-text article views including HTML views, PDF and ePub downloads, according to the available data) and Abstracts Views on Vision4Press platform.
Data correspond to usage on the plateform after 2015. The current usage metrics is available 48-96 hours after online publication and is updated daily on week days.
Initial download of the metrics may take a while.