Fig. 10
Download original image
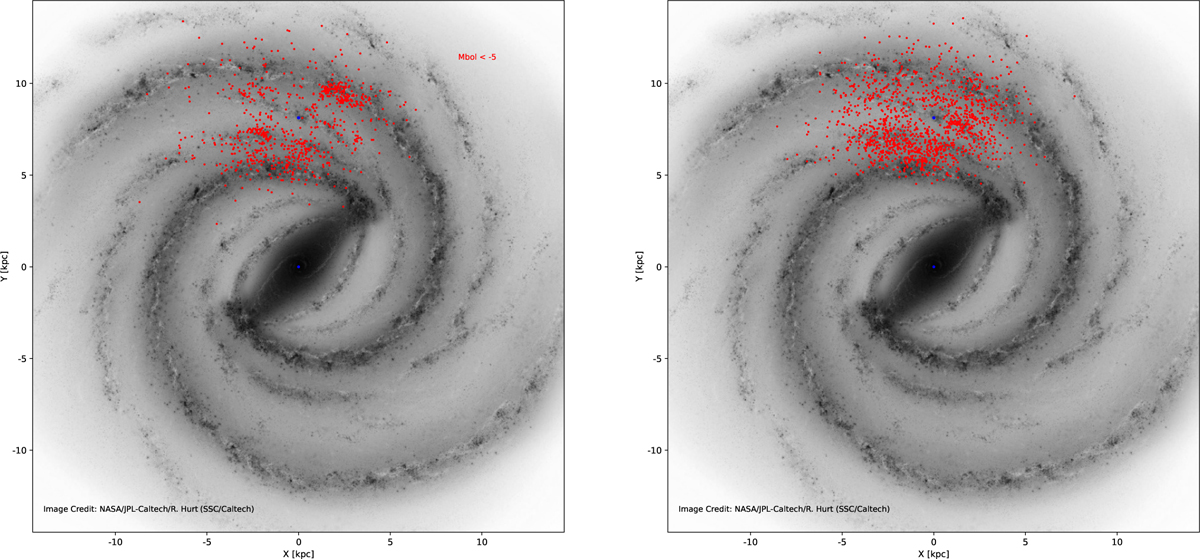
Right panel: XY view of stars located in areas A and B of Mbol versus Teff diagram of Messineo & Brown (2019) and newly selected Gaia-2MASS cRSGs, which are also located in areas A and B (red dots). The background grayscale image is the artistic XY view of the Galactic plane illustrated by Dr. Hurt. Left panel: red data points show the complementary dataset (2122 stars with equal brightness (MK< −8.5 mag), which were excluded from the cRSGs).
Current usage metrics show cumulative count of Article Views (full-text article views including HTML views, PDF and ePub downloads, according to the available data) and Abstracts Views on Vision4Press platform.
Data correspond to usage on the plateform after 2015. The current usage metrics is available 48-96 hours after online publication and is updated daily on week days.
Initial download of the metrics may take a while.